Cross-Sectional Distribution of Hypertension Awareness Rate Among Adults Aged 15 To 49 Years in Kenya
Received Date: December 19, 2025 Accepted Date: December 31, 2025 Published Date: January 05, 2026
doi:10.17303/jdmt.2026.3.101
Citation: Eliud Koech, Charles K. Mutai, Gregory Kerich (2025) Cross-Sectional Distribution of Hypertension Awareness Rate Among Adults Aged 15 To 49 Years in Kenya. J Data Sci Mod Tech 3: 1-15
Abstract
Background: Hypertension remains a major public health issue in Kenya, with awareness levels varying widely across populations, underscoring the need to understand its sociodemographic and geographic determinants. We aimed at examinining the cross-sectional distribution of hypertension awareness at the national and subnational levels, disaggregated by sex and age group.
Methods: We analyzed data from 30,570 respondents aged 15 to 49 years from the most recent Demographic and Health Survey. Hypertension awareness was examined nationally and subnationally, disaggregated by sex and age group. Regional patterns were explored, and a log-binomial regression model was used to assess the relative contributions of age, sex, and region to awareness.
Results: Awareness was higher among females (8.6%) than males (3.0%) across most counties. Males showed persistently low awareness across all ages, while awareness increased with age, especially among females aged 25 to 49. County differences were notable: Kirinyaga, Taita Taveta, Laikipia, Tharaka-Nithi, and Kajiado had the highest female awareness, whereas Mandera, West Pokot, and Garissa showed low awareness in both sexes. Regression results indicated age had the strongest effect, followed by sex and region.
Conclusions: Hypertension awareness in Kenya is shaped by intersecting effects of age, sex, and region. Women consistently demonstrate higher awareness than men, while younger populations and males remain underserved. Substantial regional disparities highlight systemic gaps in service delivery and outreach. These findings underscore the need for gender-sensitive, age-specific, and regionally tailored strategies to strengthen hypertension detection and control.
Key words: Hypertension awareness, Gender disparities, Age gradient, Regional heterogeneity, Health-seeking behavior
List of abbreviations
KDHS: Kenya Demographic and Health Surveys; CVDs: Cardiovascular Diseases; RR: Relative Risk; NCDs: Noncommunicable Diseases; CI: Confidence Interval.
Background Literature
The global burden of hypertension remains a significant concern for public health and a major cause of premature death worldwide. In 2023, global estimates showed that 1.28 billion adults aged 30 to 79 years live with hypertension, while 46% and less than 42% of adults with hypertension are unaware of the condition and are diagnosed and treated, respectively. Despite progress in diagnosis and access to treatment, hypertension continues to have a substantial impact, with low- and middle-income countries being particularly affected and accounting for two-thirds of all hypertensive individuals [1].
In Kenya, cardiovascular diseases (CVDs) is the second leading cause of death after HIV, and hypertension contributes significantly to the mortality [2,3]. In 2015, Kenya, had a awareness rate of 24% of hypertension, and 78% of those with a diagnosis do not receive treatment. Only 3% of the patients receiving treatment have successfully controlled their blood pressure [4], and additionally 2.1 million individuals with hypertension would require adequate treatment to reach a 50% control rate [5].
Nevertheless, concerted efforts have been undertaken to mitigate this risk. In this context, Sustainable Development Goal (SDG) target 3.4 of the 2030 Agenda for Sustainable Development, adopted by the United Nations General Assembly in 2015, seeks to reduce premature mortality from non-communicable diseases (NCDs) by one-third through strengthened prevention and treatment strategies [6].
Similarly, efforts to implement hypertension prevention programs in Kenya have been extensive, but the chronic condition continues to rise throughout the country [7-9]. The country remains behind in achieving Africa's three fast-track goals for 2030: diagnosing 80% of adults with hypertension, ensuring 80% of those diagnosed (equivalent to 64% of all hypertensive individuals) receive treatment, and achieving blood pressure control in 80% of treated patients [10]. The lack of progress in attaining these targets highlights the need for more effective interventions and strategies.
Hypertension incidence and prevalence vary significantly across age groups, sexes, and counties within Kenya. Overall, by the year 2020, hypertension affected 28.6% of the population, with prevalence of 29.2% in males and 27.9% in females. It was observed in 17.7% of individual’s aged 18 to 29 and 58.3% of those aged 60 to 69 [11]. The disparities in hypertension prevalence can be attributed to complex socio-behavioural, religious, socio-economic, and cultural factors both within and between counties. Therefore, designing effective interventions becomes challenging, requiring tailored responses based on the specific details of the hypertension epidemic in different populations.
Moreover, increasing urbanisation and unhealthy lifestyle choices, including poor diet and physical inactivity, may gradually increase high blood pressure further [12]. Unfortunately, Africa's population-wide implementation of high blood pressure awareness and control initiatives has not advanced sufficiently throughout the years [13].
Studies have been done to understand the extent of hypertension in Kenya, among them include, Mohamed et al. [14] who used data from the 2015 Kenya STEPs survey, a countrywide cross-sectional household survey that focused on randomly selected people between the ages of 18 and 69, to offer the first nationally representative estimates of hypertension in Kenya.
This study aimed at assessing the cross-sectional distribution of hypertension awareness rate in Kenya and examine its variation across age groups, sexes, and counties. This is critical for monitoring the effectiveness of hypertension control programs and identifying population subgroups or regions where targeted interventions are most needed.
The study reveals that analyzing hypertension awareness rate across different Kenyan subgroups can provide valuable insights for public health policy and intervention strategies. Understanding shifts in hypertension rates and the underlying determinants of these variations supports the formulation of targeted, evidence-based approaches to prevention and control. This study aligns with Kenya's Health Policy 2014-2030, specifically Policy Objective 2, which aims to halt and reverse the rising burden of NCDs and mental health disorders [15].
Methods
Data Description
The research utilized data from the 2022 Kenya Demographic and Health Survey (KDHS), part of the Demographic and Health Surveys (DHS) program, which comprises cross-sectional, household-based surveys designed to assess health-related outcomes [16]. At the preprocessing phase, the male and female datasets were integrated with their respective household datasets, including only those with known hypertension status. The analysis was restricted to individuals aged 15 to 49 years, consistent with the Demographic and Health Surveys (DHS) sampling framework. Self-reported hypertension status was used as the outcome variable and was coded dichotomously (0 = no hypertension, 1 = hypertension).
Statistical Analysis
The number of male and female respondents with non-missing hypertension data was established, and the survey’s overall sample sizes as well as those within particular county stratifications were determined.
The awareness rate of hypertension, along with 95% confidence intervals, was estimated separately for females and males based on complex sampling structure of the survey data. Both overall (national) and subnational (county) estimates were generated, disaggregated by county and age group (15 to 24, 25 to 34, and 35 to 49 years ), each stratified by sex (male, female). The absolute difference in the awareness rate between females and males were computed, these were compared across the regions.
To identify association of hypertension among males and females, a log-binomial regression model was fitted. It is a binomial generalized linear model (GLM) with a log link function and it is generally preferred in applications as an alternative to logistic regression since the parameters are adjusted relative risks rather than adjusted odds ratio [17], [18], [19], [20]. The model with a log link function was specified to model the binary outcome hypertension variable based on county of residence capturing regional heterogeneity, sex for interpretation of adjusted sex effects, and age group controlling for age-related differences in hypertension risk.
The model is represented as:
Based on the model, the effect of each covariate on the outcome (hypertension positive) was expressed as a risk ratio.
The analysis was implemented using the svyglm() function from the survey package in R, which enables generalized linear modeling with appropriate adjustment for survey weights, clustering, and stratification. This also accounted for the two-stage cluster sampling design which was used in the surveys [21].
Results
Overall, 30,570 respondents were surveyed, comprising 13,669 males (44.7%) and 16,901 females (55.3%), indicating a modest female majority, as shown in Table 1. At the county level, females consistently outnumbered males, except in Tharaka-Nithi where the reverse was observed. The distribution was relatively balanced in Nyeri, Kirinyaga, Murang’a, Kiambu, Nyandarua, Laikipia, and Meru counties, while wider gaps (over 100) favoring females were evident in several counties such as Busia, Migori, Mandera, and Wajir. Notably, urban counties such as Nairobi and Nakuru also recorded higher numbers of female respondents.
County-Specific Hypertension awareness rate
Overall, as it is shown in Table 2 and Figure 1, hypertension awareness was markedly higher among females (8.56%, 95% CI: 7.90–9.28) compared to males (2.97%, 95% CI: 2.59–3.40). At the county level, a consistent pattern of higher awareness among females than males was observed across nearly all regions, although the magnitude of difference varied. Particularly high awareness among females was noted in Kirinyaga (22.0%), Taita Taveta (18.1%), Laikipia (15.6%), and Tharaka-Nithi (14.7%), while the lowest female awareness rates were reported in Samburu (1.7%) and Garissa (2.3%). Among males, the highest awareness rates were observed in Nyandarua (5.4%), Nyeri (5.0%), Vihiga (5.0%), and Homa Bay (5.8%), although these remained substantially lower than corresponding female rates. In a few counties such as Turkana (4.4%) and Samburu (4.7%), male awareness surpassed that of females.
Age-specific hypertension awareness rate trends in counties
As shown in Table 3 and illustrated in Figure 2, overall, hypertension awareness increased with age and was consistently higher among females than males across all age groups. Among respondents aged 15 to 24 years, awareness was low in both sexes, with females reporting 3.3% (95% CI: 2.7–3.9) compared to 0.9% (95% CI: 0.6–1.3) in males. In the 25 to 34 age group, awareness rose to 8.6% (95% CI: 7.6–9.8) among females and 2.2% (95% CI: 1.6–3.1) among males. The highest awareness was observed in the 35 to 49 age group, where 14.7% (95% CI: 13.4–16.2) of females reported awareness compared with 2.9% (95% CI: 2.6–3.4) of males. County-specific analyses revealed marked heterogeneity: some counties such as Kirinyaga (32.5% in females aged 35 to 49) and Kajiado (23.8% in females aged 35 to 49) reported substantially higher awareness, while others such as Mandera, West Pokot, and Garissa recorded very low rates across all age groups and sexes. Interestingly, a few exceptions were observed in counties such as Turkana, Samburu, and Homa Bay, where male awareness in specific age groups approached or exceeded that of females.
Relative changes in hypertension awareness rate trends between females and males in across regions
At the national level, the relative change in hypertension awareness rates between females and males was 5.6%, underscoring a general advantage among females, as shown in Table 4 and illustrated in Figure 3. County-level variations, however, revealed substantial heterogeneity. The largest relative differences favoring females were observed in Kirinyaga (18.0%), Taita Taveta (13.5%), Laikipia (11.1%), Tharaka-Nithi (10.3%), and Kajiado (10.6%). Moderate differences were evident in Uasin Gishu (8.4%), Murang’a (8.5%), Nyeri (9.3%), and Nakuru (7.4%). In contrast, minimal differences were recorded in counties such as Busia (0.5%), Marsabit (0.4%), and Garissa (0.8%). Notably, negative changes, indicating higher awareness among males compared to females, were observed in Samburu (-3.0%), Turkana (-1.1%), and Tana River (-0.2%). Overall, these findings highlight pronounced regional disparities, with most counties exhibiting higher female awareness, although a few counties deviate from the national trend with males showing equal or greater awareness.
Discussions
This study analyzed data from 30,570 respondents comprising 13,669 males (44.7%) and 16,901 females (55.3%) to examine the cross-sectional distribution of hypertension awareness at the national and subnational levels, disaggregated by sex and age group.
Hypertension awareness rate per sex in regions were estimated, and the observed pattern demonstrates a pronounced sex disparity, with females consistently reporting higher awareness rates than males across nearly all counties which is consistent with studies by [11]. This suggests that existing screening and health promotion strategies may be more accessible to, or more effective among women, potentially due to greater health-seeking behavior, frequent contact with health services through reproductive and maternal health programs, and stronger community health engagement, as is previously reported by this study [22].
However, the magnitude of the disparity varied considerably across regions, pointing to county-level differences in health system capacity, outreach coverage, and sociocultural factors. Particularly high female awareness in Kirinyaga, Taita Taveta, Laikipia, and Tharaka-Nithi may reflect more robust local health promotion or better service uptake, while the very low rates in counties such as Samburu and Garissa indicate persistent gaps in reaching marginalized populations. Collectively, these findings underscore the need for gender-sensitive and regionally tailored interventions, with greater emphasis on addressing the barriers men face in accessing hypertension education and screening.
The age- and sex-specific analysis revealed a clear gradient in hypertension awareness, with awareness increasing with age and consistently higher among females than males across all age categories. Awareness was lowest in the youngest cohort (15 to 24 years), suggesting that younger populations remain largely undiagnosed and uninformed about their hypertension status, particularly among males This is consistent with this study [23], that found that awareness of hypertension is positively associated with older, meaning younger age groups have lower awareness. The steep rise in awareness among females in the 25 to 34 and 35 to 49 age groups may reflect their greater engagement with healthcare services during reproductive years, as well as targeted health education interventions that disproportionately reach women [24,25].
Notably, awareness among males remained markedly low even in older age groups, underscoring persistent gendered barriers in health-seeking behavior, as is in previous studies [26]. County-level differences further highlighted stark heterogeneity: counties such as Kirinyaga and Kajiado reported substantially higher female awareness, indicating stronger local health system performance, whereas Mandera, West Pokot, and Garissa consistently reported low awareness across both sexes, reflecting systemic gaps in service delivery and outreach, a finding that is also highlighted in previous studies [14,27].
Interestingly, isolated cases in Turkana, Samburu, and Homa Bay showed male awareness rates approaching or exceeding those of females, may reflect data limitations, for instance sampling variability, small sub-samples, or reporting bias. Alternatively, they could signal localized sociocultural or programmatic dynamics that invert the typical gender pattern. Further investigation with more granular, representative data is warranted.
Overall, these findings highlight the importance of both age- and gender-sensitive approaches to hypertension awareness, with a particular need to prioritize outreach to younger populations and men, as well as targeted strategies in underserved counties.
At the national level, the relative change in hypertension awareness between females and males was 5.6%, confirming a consistent female advantage. However, county-level analyses revealed marked heterogeneity in the magnitude and direction of this difference, consistent with findings reported in this study [27]. The largest gaps favoring females were observed in Kirinyaga, Taita Taveta, Laikipia, Tharaka-Nithi, and Kajiado, reflecting regions where health interventions may have been particularly effective among women or where female engagement with healthcare services is comparatively stronger, consistent with findings reported in this study [29]. Moderate differences, such as those in Uasin Gishu, Murang’a, Nyeri, and Nakuru, suggest more balance, but still female-biase, patterns of awareness.
Conversely, counties such as Busia, Marsabit, and Garissa exhibited minimal sex differences, indicating a relative narrowing of the gender gap, though awareness levels in these areas were generally low. Taken together, these findings underscore both the persistence of gender disparities and the importance of tailoring hypertension awareness interventions to the distinct demographic and cultural contexts of individual counties.
A log-binomial regression model was employed to examine the influence of age, sex, and region on awareness rates, offering a clear delineation of the relative contributions of these factors. The analysis revealed that age exerted the greatest influence, followed by sex and region, with variations in age producing the most substantial impact on awareness.
Despite its strengths, this study has limitations. The finding that females constituted a modest majority of the respondents nationally, and were consistently more represented than males across most counties, warrants careful consideration. This imbalance may reflect gendered patterns of availability during survey implementation, as women are more likely to be found at home compared to men who may be engaged in formal or informal employment outside the household. In addition, cultural and social dynamics in some regions may encourage women’s participation in health-related surveys more than men’s, thereby shaping the observed distribution. This skewed sex distribution has important implications for interpreting hypertension awareness estimates, as it may amplify the weight of female-specific patterns in the overall analysis.
Also, this study’s cross-sectional design nature precludes causal inference and prevents the examination of trends over time. Longitudinal data would be essential for understanding temporal dynamics and evaluating the effectiveness of interventions. Another limitation of the study is that the analysis was restricted to individuals aged 15 to 49 years, in line with the DHS framework. This constraint may limit the data available and excludes older populations who bear the greatest burden of hypertension, thereby reducing representativeness.
This study revealed significant disparities in hypertension awareness across sex, age, and region in Kenya. Women consistently reported higher awareness than men, likely due to greater health-seeking behavior and contact with reproductive health services, while men showed persistently low awareness across all age groups. Awareness rose with age but was lowest among young adults, particularly males. County-level differences were pronounced, with some areas demonstrating strong performance and others showing systemic gaps. Regression analysis confirmed age as the strongest predictor, followed by sex and region. Overall, the findings underscore the need for gender-sensitive, age-specific, and regionally tailored interventions rather than uniform national strategies.
From the findings, this study recommend policies change to expand outreach strategies that deliberately engage men, such as workplace-based screenings, male-friendly community health programs, and integration of screening into services beyond reproductive and maternal health. Embed hypertension education and screening in schools, tertiary institutions, and youth-oriented programs, leveraging digital platforms and peer networks to reach younger populations. Scale up best practices from high-performing counties and direct additional resources to underserved regions such as Mandera, West Pokot, Samburu, and Garissa, where systemic barriers persist. Strengthen primary healthcare and community health worker capacity to deliver routine screening to both sexes, particularly in rural and marginalized communities.
In conclusion, improving hypertension awareness in Kenya requires a comprehensive, equity-driven approach that prioritizes men, youth, and underserved counties while consolidating gains among women. Such targeted strategies are critical to closing awareness gaps and advancing progress toward national and global targets for the prevention and control of hypertension.
Declarations
Not applicable
Availability of data and materials
The datasets used and/or analysed during the current study are available from this link https://dhsprogram.com/data/dataset/Kenya_Standard-DHS_2022.cfm?flag=0
Ethics approval and consent to participate
No medical ethical approval and informed consent to participate were needed for this study.
Consent for publication
Not applicable.
Competing interests
The authors declare that they have no competing interests. All authors approved the final manuscript.
Funding
Not applicable
Authors' contributions
CM had full access to all study data and was responsible for ensuring data integrity. EK conceptualized the study, processed the data using appropriate software, and produced the results presented in this manuscript. GK verified the accuracy of the data analysis. CM assisted in interpreting the findings. EK prepared the initial draft, with all authors contributing significant revisions. CM and GK reviewed and provided feedback on the final draft, which EK finalized. All authors reviewed and approved the final version of the manuscript.
Acknowledgements
Not applicable.
- WHO, “Hypertension,” World Health Organization. Accessed: Oct. 01, 2025. [Online].Available: https://www.who.int/news-room/fact-sheets/detail/hypertension
- B. Wamuti et al. (2023) “‘My people perish for lack of knowledge’: barriers and facilitators to integrated HIV and hypertension screening at the Kenyatta National Hospital, Nairobi, Kenya,” Open Heart, 10: p. e002195.
- A. Waruru et al. (2022) “Leading causes of death and high mortality rates in an HIV endemic setting (Kisumu county, Kenya, 2019),” PLOS ONE, 17: p. e0261162,
- Kenya National Bureau of Statistics, “Kenya Stepwise Survey for Non Communicable Diseases Risk Factors 2015 Report,” 2015. Accessed: Nov. 28, 2024. [Online]. Available: https://statistics.knbs.or.ke/nada/index.php/catalog/24/related-materials
- WHO, “Hypertension Kenya 2023 country profile,” Technical document, 2023. Accessed: Nov. 28,2024. [Online]. Available: https://www.who.int/publications/m/item/hypertension-ken-2023-country-profile
- Resolution A/RES/70/1, “Transforming our world : the 2030 Agenda for Sustainable Development : resolution / adopted by the General Assembly on 25 September 2015,” A/RES/70/1. Accessed: Aug. 14, 2024.[Online]. Available: https://digitallibrary.un.org/record/3923923
- E. N. Ogola, F. O. Okello, J. L. Herr, E. Macgregor-Skinner, A. Mulvaney, and G. Yonga (2019) “Healthy Heart Africa-Kenya: A 12-Month Prospective Evaluation of Program Impact on Health Care Providers’ Knowledge and Treatment of Hypertension,” Glob. Heart, 14: pp. 61–70.
- S. Subramanian et al. (2017) “Research for Actionable Policies: implementation science priorities to scale up non–communicable disease interventions in Kenya,” J. Glob. Health, 7: p. 010204.
- E. Nolte et al. (2022) “Scaling up the primary health integrated care project for chronic conditions in Kenya: study protocol for an implementation research project,” BMJ Open, 12: e056261.
- T. Campbell (2025) “How to Improve Awareness, Treatment, and Control of Hypertension in Africa, and How to Reduce Its Consequences.” Accessed: Apr. 15, 2025. [Online]. Available: https://www.whleague.org/index.php/hypertension-resources/calls-to-action/94-how-to-impr ove-awareness-treatment-and-control-of-hypertension-in-africa-and-how-to-reduce-its-conse quences
- S. Pengpid and K. Peltzer (2020) “Prevalence, awareness, treatment and control of hypertension among adults in Kenya: cross-sectional national population-based survey,” East. Mediterr. Health J. Rev. Sante Mediterr. Orient. Al-Majallah Al-Sihhiyah Li-Sharq Al-Mutawassit, 26: 923–32.
- W. K. Bosu, S. T. Reilly, J. M. K. Aheto, and E. Zucchelli (2019) “Hypertension in older adults in Africa: A systematic review and meta-analysis,” PLoS ONE, 14: e0214934.
- D. Adeloye and C. Basquill (2014) “Estimating the prevalence and awareness rates of hypertension in Africa: a systematic analysis,” PloS One, 9: e104300.
- S. F. Mohamed et al. (2018) “Prevalence, awareness, treatment and control of hypertension and their determinants: results from a national survey in Kenya,” BMC Public Health, 18: 1219.
- Ministry of Health, “Kenya Health Policy 2014-2030: Towards Attaining the Highest Standards of Health,” Afya House Cathedral Road, 2014. Accessed: Nov. 28, 2024. [Online].Available: https://repository.kippra.or.ke/handle/123456789/4681?show=full
- “The DHS Program - Demographic and Health Survey (DHS).” Accessed: July 09, 2025. [Online]. Available: https://dhsprogram.com/methodology/Survey-Types/DHS.cfm
- M. Nurminen (1995) “To use or not to use the odds ratio in epidemiologic analyses?,” Eur. J. Epidemiol., vol. 11: 365–71.
- S. Wacholder (1986) “Binomial regression in GLIM: estimating risk ratios and risk differences,” Am. J. Epidemiol., 123: 174–84.
- S. Greenland (1987) “Interpretation and choice of effect measures in epidemiologic analyses,” Am. J. Epidemiol., 125: 761–8.
- C. O. Schmidt and T. Kohlmann (2008) “When to use the odds ratio or the relative risk?,” Int. J. Public Health, 53: 165–7.
- T. Lumley, Complex Surveys: A Guide to Analysis Using R. John Wiley & Sons, 2011.
- N. Sikka et al. (2021) “Sex differences in health status, healthcare utilization, and costs among individuals with elevated blood pressure: the LARK study from Western Kenya,” BMC Public Health, 21: 948.
- S. M. Gatimu and T. W. John (2020) “Socioeconomic inequalities in hypertension in Kenya: a decomposition analysis of 2015 Kenya STEPwise survey on non-communicable diseases risk factors,” Int. J. Equity Health, 19: 213.
- F. X. Gómez-Olivé et al. (2017) “Regional and Sex Differences in the Prevalence and Awareness of Hypertension: An H3Africa AWI-Gen Study Across 6 Sites in Sub-Saharan Africa,” Glob. Heart, 12: 81–90.
- M. M. Domba, T. G. Argefa, A. T. Gizaw, and A. K. Bitew (2024) “Magnitude of non-communicable disease screening and factors associated with awareness among reproductive age women in Gofa and Basketo zones, Southern Ethiopia: a community-based cross-sectional study,” Front. Glob. Womens Health, 5.
- A. J. Muhihi et al. (2020) “Prevalence, Awareness, Treatment, and Control of Hypertension among Young and Middle-Aged Adults: Results from a Community-Based Survey in Rural Tanzania,” Int. J. Hypertens., p. 9032476.
- A. M. Bashir (2025) “Awareness of Stroke Risk Factors and Warning Signs among Hypertensive Patients Attending Garrissa County Refferral Hospital in Garrissa County, Kenya.,” Kenyatta University, 2025. Accessed: Sept. 29, 2025. [Online]. Available: https://ir-library.ku.ac.ke/handle/123456789/31176
- L. Mbau et al. (2024) “May Measurement Month 2021: an analysis of blood pressure screening results from Kenya,” Eur. Heart J. Suppl. J. Eur. Soc. Cardiol., 26: iii51–iii4,
- C. G. of Laikipia (2025) “World Hypertension Month. LHS Launches Blood Pressure Testing Across Outlets to Address Rising Hypertension Concern,” County Government of Laikipia. Accessed: Sept. 29, 2025. [Online]. Available: https://laikipia.go.ke/1451/world-hypertension-month-lhs-launches-blood-pressure-testing-ac ross-outlets-address-rising-concern/
FIGURE 1
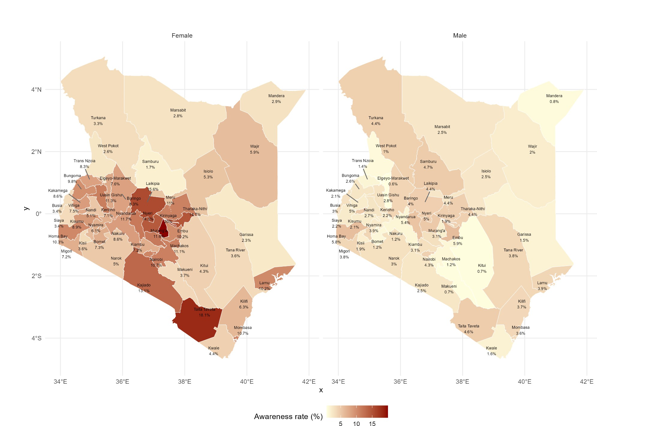
Figure 1: Map plot of hypertension awareness rates across counties, disaggregated by sex
FIGURE 2
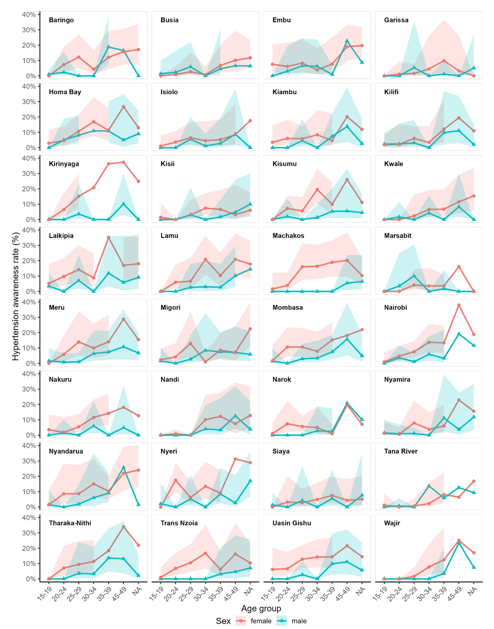
Figure 2: Line plot showing hypertension awareness rates by age group and sex across regions
FIGURE 3
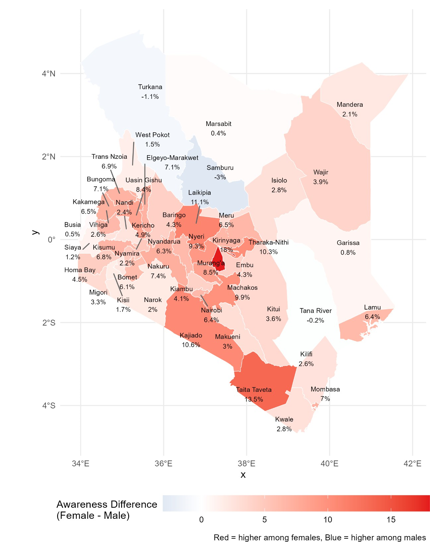
Figure 3: Map illustrating the difference in hypertension awareness rates between females and males (Positive values (red bars) indicate higher awareness among females, while negative values (blue bars) indicate higher awareness among males)
Tables at a glance
Figures at a glance