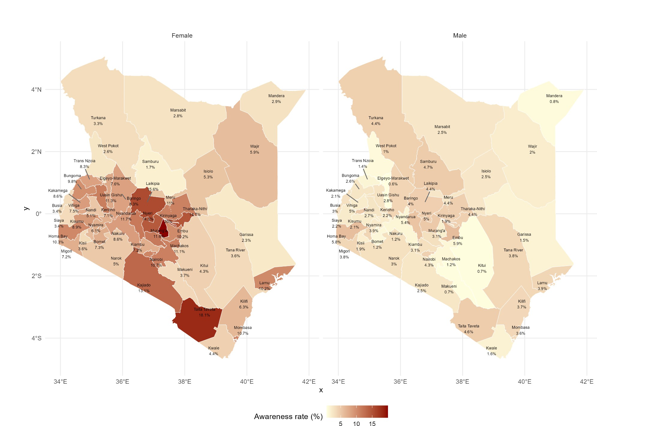
Figure 1: Map plot of hypertension awareness rates across counties, disaggregated by sex
Figure 1: Map plot of hypertension awareness rates across counties, disaggregated by sex
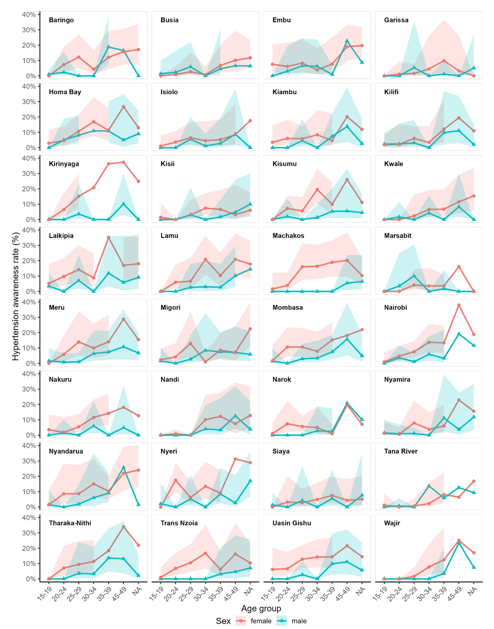
Figure 2: Line plot showing hypertension awareness rates by age group and sex across regions
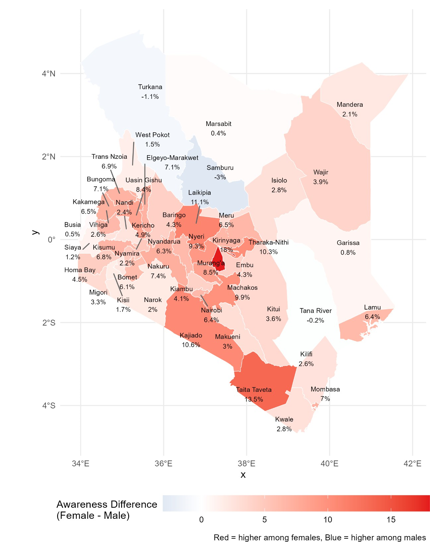
Figure 3: Map illustrating the difference in hypertension awareness rates between females and males (Positive values (red bars) indicate higher awareness among females, while negative values (blue bars) indicate higher awareness among males)
Tables at a glance
Figures at a glance