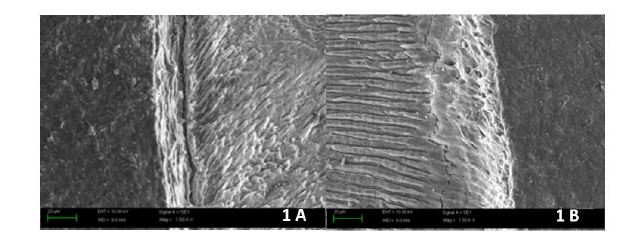
Figure 1: SEM photomicrograph of resin- dentin interface of Group 1 (No Pretreatment): Immediate (1A), Delayed (1B); interfacial gap is evident at nine months.
Figure 1: SEM photomicrograph of resin- dentin interface of Group 1 (No Pretreatment): Immediate (1A), Delayed (1B); interfacial gap is evident at nine months.
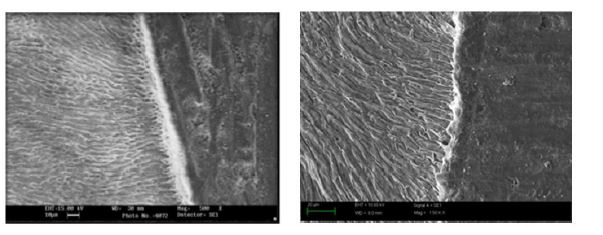
Figure 2: SEM photomicrograph of resin- dentin interface of Group 2 (Baicalein): Immediate (2A), Delayed (2B); good interfacial adaptation can be observed at both time periods.
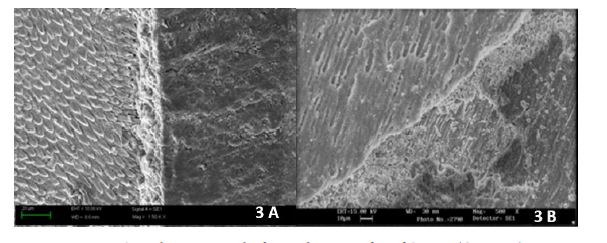
Figure 3: SEM photomicrograph of resin- dentin interface of Group 3 (Curcumin): Immediate (3A), Delayed (3B); good interfacial seal is evident.
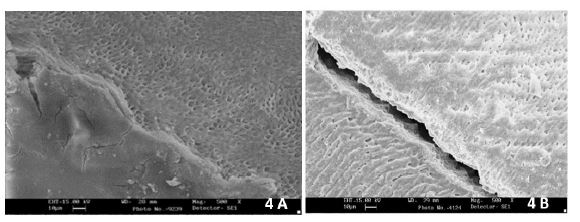
Figure 4: SEM photomicrograph of resin- dentin interface of Group 4 (Berberine): Immediate (4A), Delayed (4B); interfacial gap is observed at nine months.
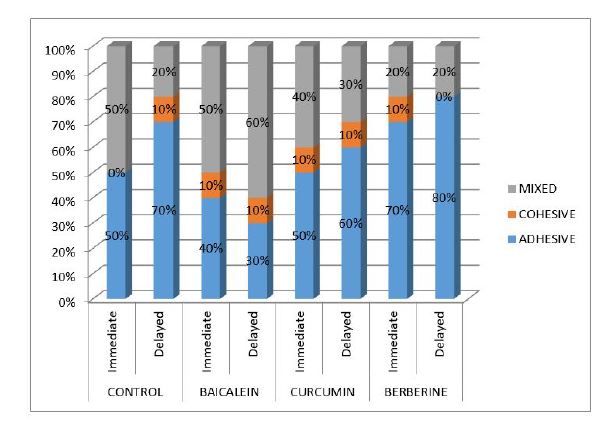
Figure 5: Failure mode analysis
Tables at a glance
Figures at a glance