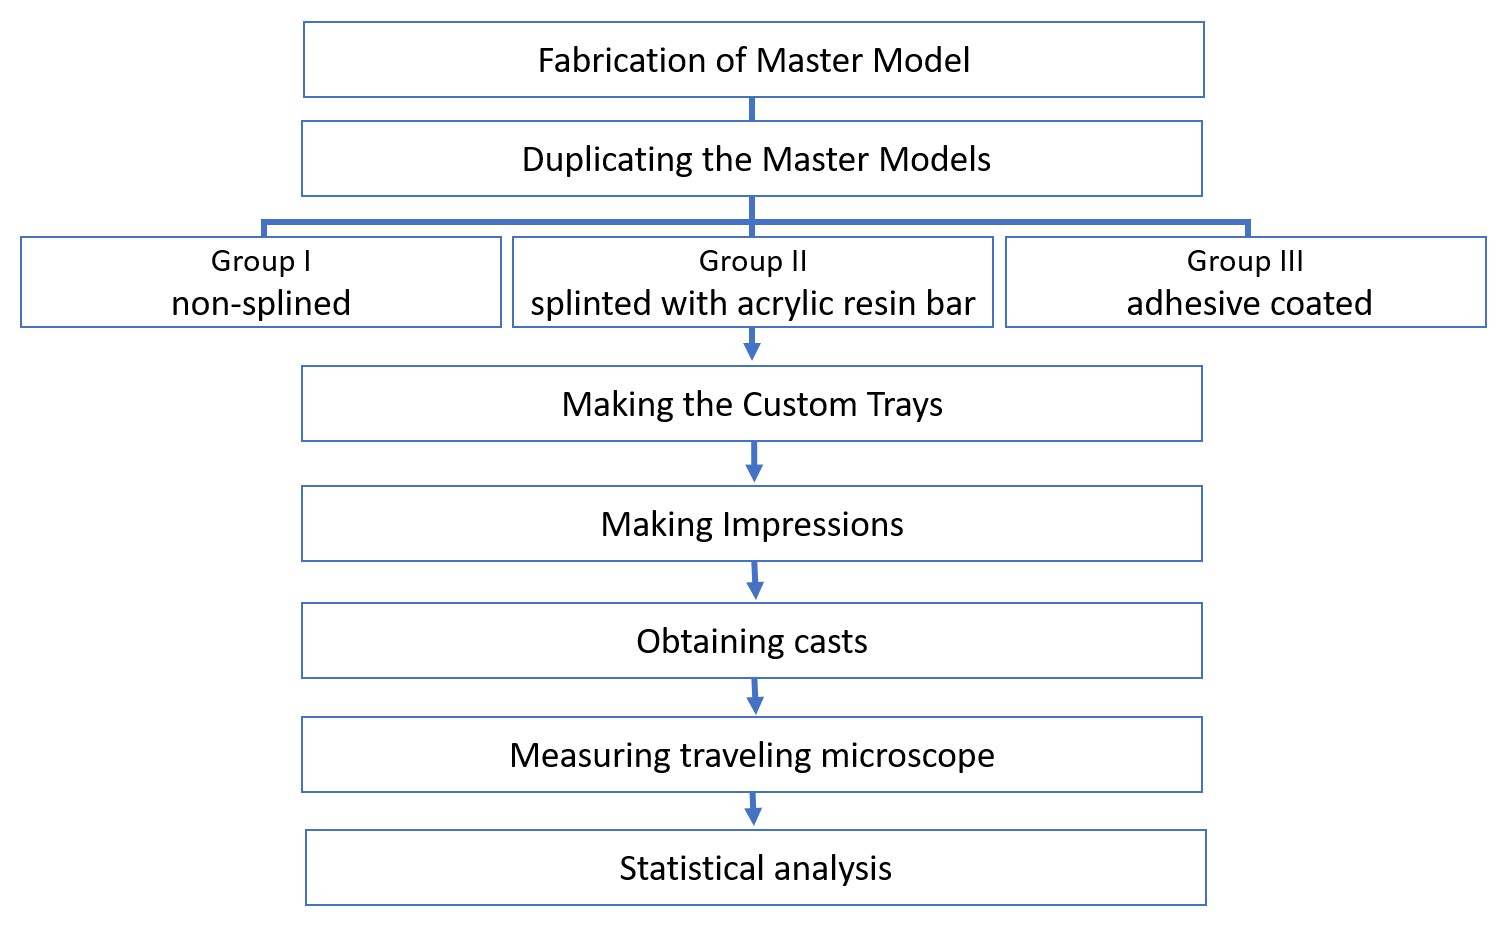
Figure 1: Flow chart of the procedure used in the study
Figure 1: Flow chart of the procedure used in the study
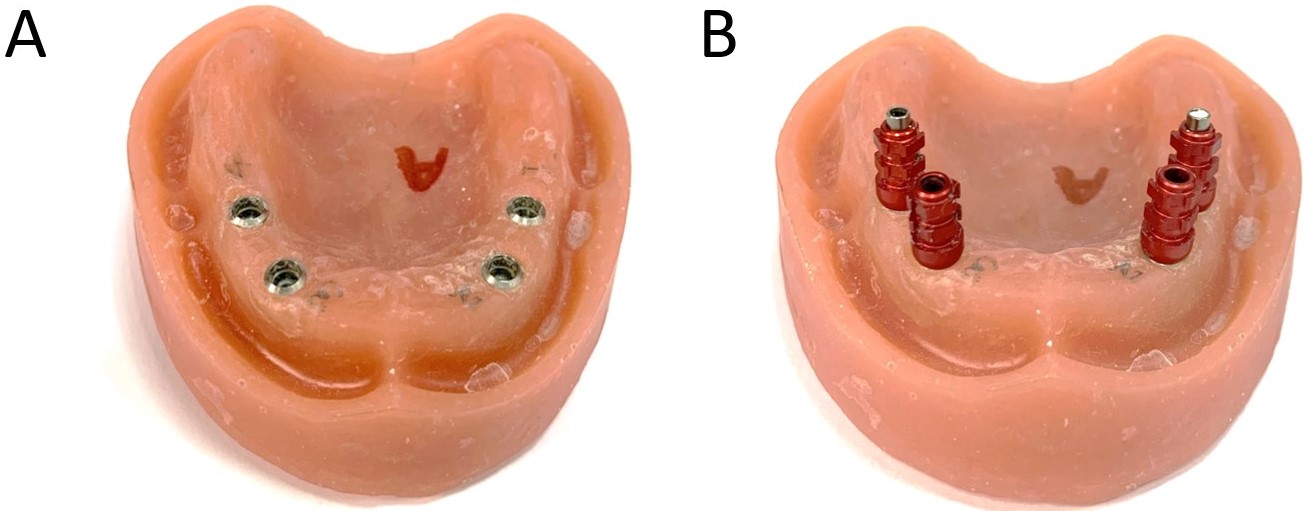
Figure 2: Photograph of the (A) acrylic resin master model, (B) master cast with the implant analogs
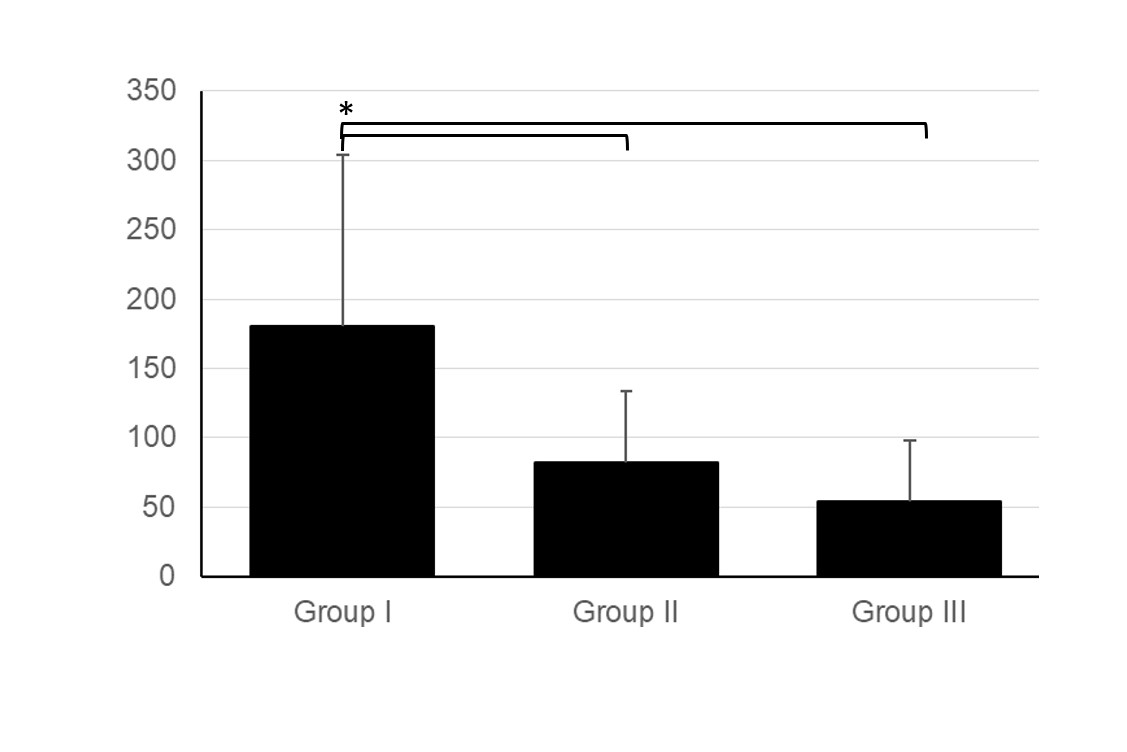
Figure 3: Chart showing the change in distance (μm) between the copings in the master model and casts for different groups (Group I: non-splinting; Group II: splinting with auto-polymerizing acrylic resin; and Group III: coating with an adhesive). * indicate significant difference (p≤0.05) between groups
Tables at a glance
Figures at a glance