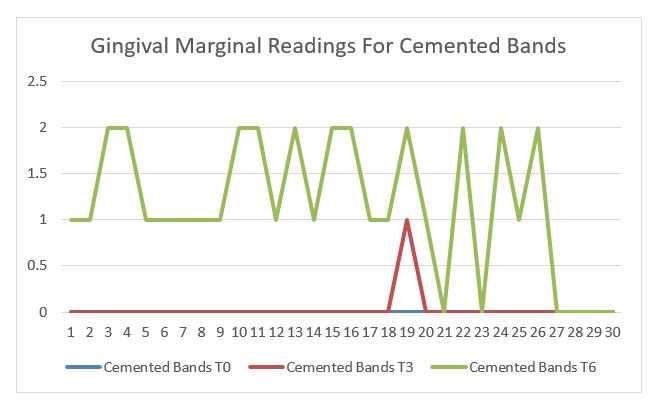
Figure 1: Descriptive statistics for Gingival marginal readings for cemented bands from T0 – T6
Figure 1: Descriptive statistics for Gingival marginal readings for cemented bands from T0 – T6
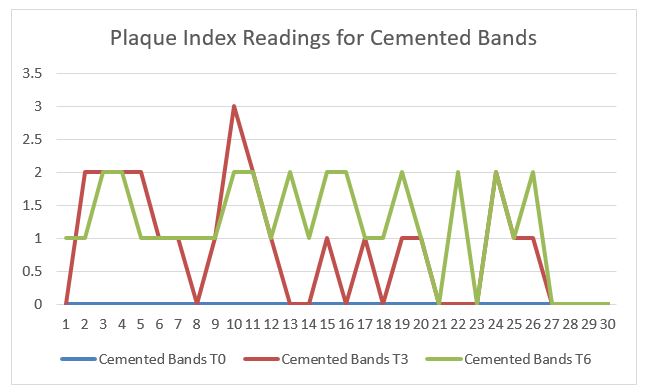
Figure 2: Descriptive statistics for Plaque Index readings for cemented bands from T0 – T6
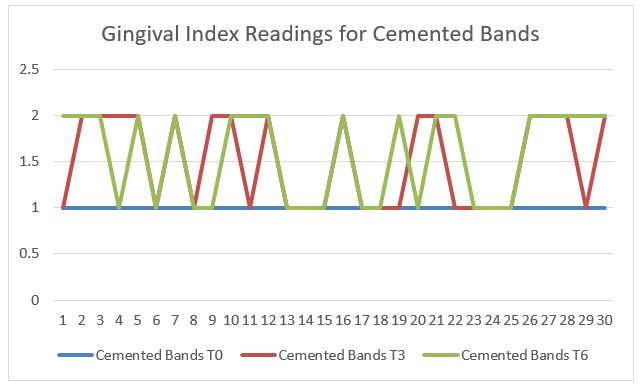
Figure 3: Descriptive statistics for Gingival Index readings for cemented bands from T0 – T6
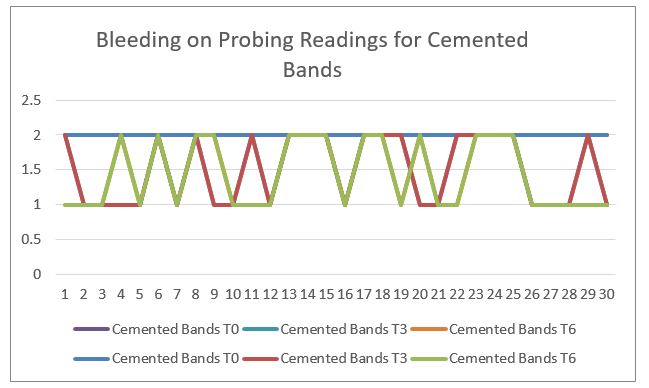
Figure 4: Descriptive statistics for Bleeding on Probing readings for cemented bands from T0 – T6 as 1 means bleeding, 2 means no bleeding
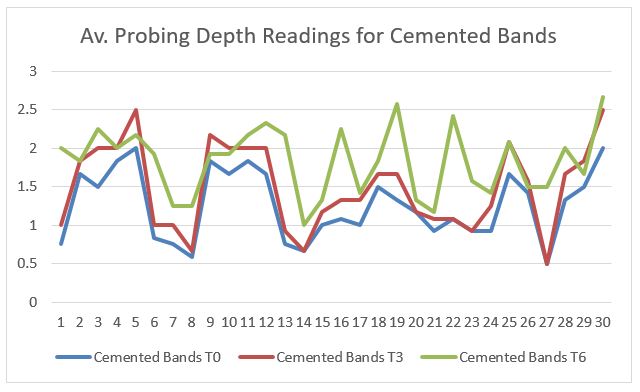
Figure 5: Descriptive statistics for Av. Probing Depths readings for cemented bands from T0 – T6
Tables at a glance
Figures at a glance