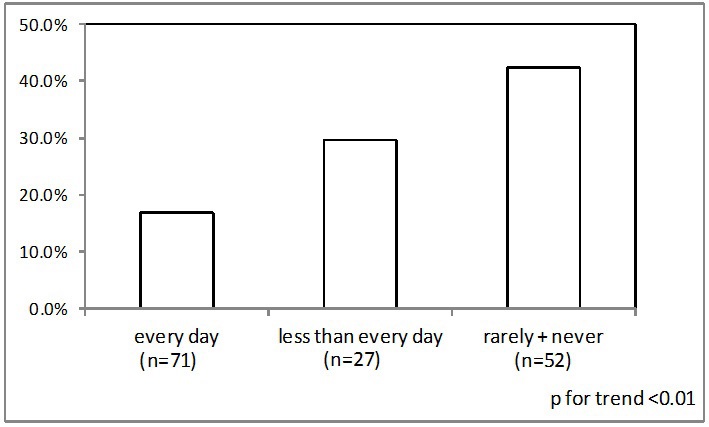
Figure 1 Percentage of those who have =30% dental plaque on anterior teeth by toothbrushing frequency.
Figure 1 Percentage of those who have =30% dental plaque on anterior teeth by toothbrushing frequency.
Table 1:Oral status by gender
|
|
|
DM F |
Gingivitis |
|||||||
Gender |
( n ) |
DM FT |
p value* |
DM F=0 |
DM F=1 |
DM F2 |
p value** |
non |
Observation |
Detailed professional examination and treatment b) |
p value** |
boy |
( 58 ) |
0.26 |
0.25 |
84.5% |
8.6% |
6.9% |
6.0% |
36.2% |
51.7% |
12.1% |
12.1% |
girl |
( 92 ) |
0.23 |
|
88.0% |
6.5% |
5.4% |
|
59.8% |
38.0% |
2.2% |
|
Total |
( 150 ) |
0.24 |
|
86.7% |
7.3% |
6.0% |
|
50.7% |
433% |
6.0% |
|
*Student's t-test
**p for trend
a) Gingivitis was observed in only few areas around all anterior teeth.
b) Gingivitis was observed in all areas around all anterior teeth.
Table 2:Relationship dental plaque and oral health status
|
|
DMF |
|
Gingivisits |
|||||
Dental plaque |
( n ) |
DMF=0 |
DMF=1 |
DMF2 |
p value* |
non |
Observation |
Detailed professional examination and treatment b) |
p value* |
non |
( 6 ) |
83.3% |
16.7% |
0.0% |
0.54 |
100.0% |
0.0% |
0.0% |
<0.01 |
<30% |
( 102) |
88.2% |
5.9% |
5.9% |
|
61.8% |
37.3% |
1.0% |
|
> 30% |
( 42 ) |
83.3% |
a5% |
7.1% |
|
16.7% |
64.3% |
19.0% |
|
Total |
( 150) |
86.7% |
7.3% |
6.0% |
|
50.7% |
43.3% |
43.3% |
|
*p for trend
a) Gingivitis was observed in only few areas around all anterior teeth.
b) Gingivitis was observed in all areas around all anterior teeth.
Table 3:Relationship between general health condition and oral symptoms
|
|
general health condition a) |
|
||
|
( n ) |
wry good |
good |
poor |
p value* |
tooth ache |
|
|
|
|
|
Yes |
( 81 ) |
27.2% |
53.1% |
19.8% |
<0.01 |
No |
( 69 ) |
53.6% |
44.9% |
1.4% |
|
tooth mobility |
|
|
|
|
|
Yes |
( 27 ) |
22.2% |
63.0% |
14.8% |
0.07 |
No |
( 123 ) |
43.1% |
46.3% |
10.6% |
|
tooth fracture |
|
|
|
|
|
Yes |
( 26 ) |
26.9% |
42.3% |
30.8% |
<0.01 |
No |
( 124 ) |
41.9% |
50.8% |
7.3% |
|
gum bleeding |
|
|
|
|
|
Yes |
( 98 ) |
37.8% |
48.0% |
14.3% |
0.25 |
No |
( 52 ) |
42.3% |
51.9% |
5.8% |
|
food impaction |
|
|
|
|
|
Yes |
( 107 ) |
40.2% |
45.8% |
14.0% |
0.59 |
No |
( 43 ) |
37.2% |
58.1% |
4.7% |
|
bad breath |
|
|
|
|
|
Yes |
( 56 ) |
28.6% |
55.4% |
16.1% |
0.03 |
No |
( 94 ) |
45.7% |
45.7% |
8.5% |
|
bad dentition |
|
|
|
|
|
Yes |
( 18 ) |
27.8% |
61.1% |
11.1% |
0.44 |
No |
( 132 ) |
40.9% |
47.7% |
11.4% |
|
sensitive tooth |
|
|
|
|
|
Yes |
( 78 ) |
41.0% |
46.2% |
12.8% |
0.97 |
No |
( 72 ) |
37.5% |
52.8% |
9.7% |
|
jaw joint noise |
|
|
|
|
|
Yes |
( 26 ) |
38.5% |
46.2% |
15.4% |
0.67 |
No |
( 124 ) |
39.5% |
50.0% |
10.5% |
|
tooth holes |
|
|
|
|
|
Yes |
( 43 ) |
41.9% |
41.9% |
16.3% |
0.77 |
No |
( 107 ) |
38.3% |
52.3% |
9.3% |
|
oral health condition b) |
|
|
|
|
|
poor |
( 30 ) |
16.7% |
43.3% |
40.0% |
<0.01 |
good |
( 82 ) |
37.8% |
58.5% |
3.7% |
|
wry good |
( 37 ) |
62.2% |
32.4% |
5.4% |
|
*p for trend
a) Perceiwd general health condition for subject.
b) Perceiwd oral health condition for subject.