Figure 1 Arestin used in the study
Figure 1 Arestin used in the study
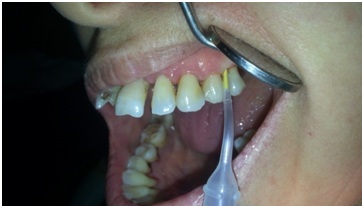
Figure 2 Application of the minocycline at the test site.
Control sites |
Minocycline sites |
Clinical parameters |
|||||
At 6 |
At 3 months |
Baseline |
At 6 months |
At 3 months |
Baseline |
||
0.85 ± |
1.15 ± 0.25 |
2.58 ± 0.36 |
0.71 ± 0.25 |
1.06 ± 0.29 |
2.46 ± 0.54 |
Mean ± |
Plaque index |
32.50 |
33.17 |
50.35 |
33.45 |
35.77
|
52.12 |
Percentage (%) |
Bleeding upon probing index |
Table1 Plaque index and bleeding upon probing values of minocycline sites versus control sites at time intervals.
Values are expressed as mean ± SD and percentage
Control sites |
Minocycline sites |
Clinical parameters |
|||||
At 6 months |
At 3 months |
Baseline |
At 6 months |
At 3 months |
Baseline |
||
4-6 |
4-7 |
5-8 |
4-6 |
4-6 |
5-8 |
Range |
Probing pocket depth |
5.58±0.41 |
5.9±0.6 |
6.53±0.34 |
4.4±0.4 * |
4.8±0.7 * |
6.28±0.5 |
Mean ±SD |
|
4-7 |
5-8 |
5-8 |
4-7 |
4-8 |
5-9 |
Range |
Clinical Attachment level |
6.45±0.7 |
6.4±0.3 |
6.9±04 |
5.7±0.15 * |
5.75±0.35 * |
6.8 ±0.2 |
Mean ±SD |
|
Table2 The probing pocket depth and clinical attachment level of the minocycline sites versus control sites at time intervals
Values are expressed as range and mean ± SD (* indicates statistical significance at P < 0.05).