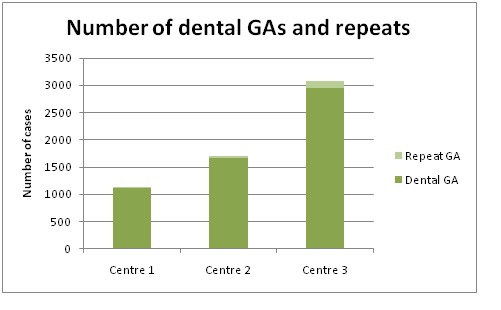
Figure 1 Histogram of number of GAs and repeats for each site.
Figure 1 Histogram of number of GAs and repeats for each site.
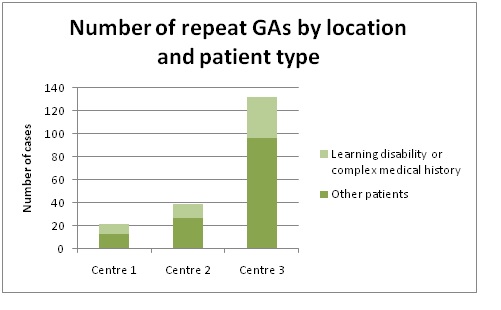
Figure 2 Histogram of patient type for repeat GAs at each site.
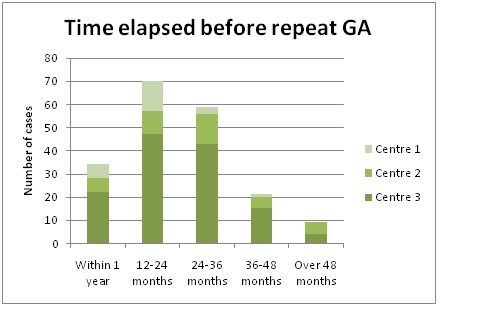
Figure 3 Histogram of time elapsed to repeat GA.
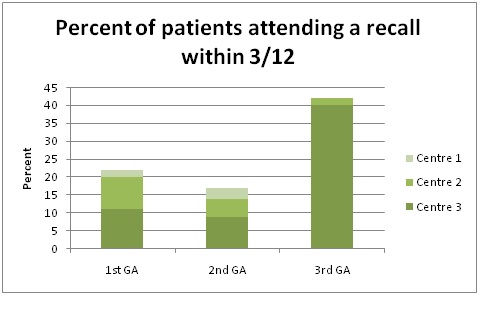
Figure 4 Histogram of number of cases attending recall within 3 months.
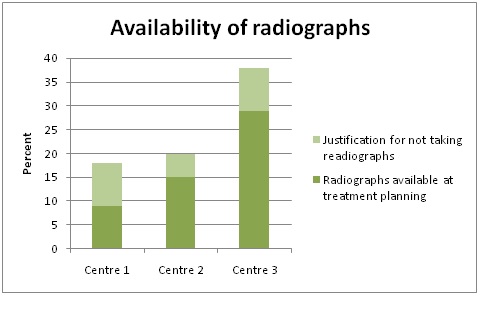
Figure 5 Histogram of the percent of cases with radiographs available at the treatment planning stage.
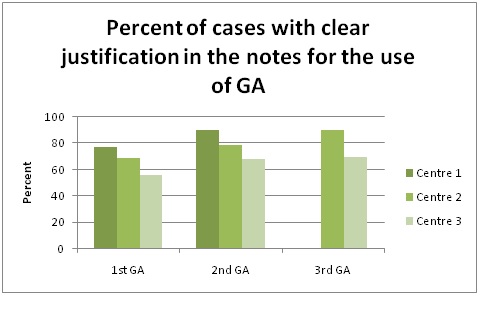
Figure 6 Histogram of the percent of cases with a clear justification in the notes for the use of GA.
Table1 Baseline Socio-demographic and clinical characteristics of patients who were taking ART in St. Paul's and ALERT hospital during January 2008 – December 2012 (n=616)
Study |
Primary care / |
Number of patients |
Mean interval |
Percentage of |
Albadraet.al16 |
Secondary |
278 (6.5y) |
2 years |
11.9 |
Harrison and Nutting15 |
Secondary |
3872 (5.3y) |
2 years |
10 |
Kakaounakiet.al. 17,18 |
Secondary |
484 (6.3y) |
1 year |
10.7 |
Savanheimo and Vehkalati19 |
Secondary |
188 (6.2y) |
1 year |
11 |
Table1 Summary of findings in studies of repeat GA
Age |
Clear justification for the use of dental GA including learning disability or complex medical history |
Date of first dental GA |
Date of second dental GA |
Date of third or subsequent dental GA |
Radiographs available prior to dental GA |
Justification for not taking radiographs |
Follow up appointment within three months |
Table2 Data collected from the dental records.