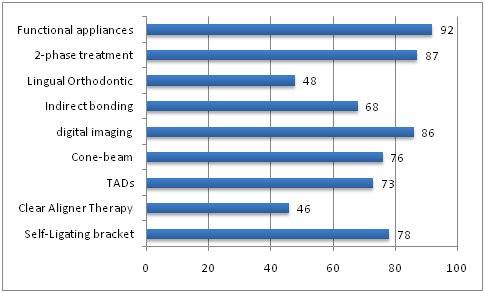
Figure 1 Practice used by orthodontists in Saudi Arabia by percentage
Figure 1 Practice used by orthodontists in Saudi Arabia by percentage
Respondents |
N % |
Age |
|
25 – 30 years |
5 8 |
31 – 40 years |
22 35 |
41 – 50 years |
18 28.5 |
51 years and above |
18 28.5 |
Gender |
|
Male |
50 80 |
Female |
13 20 |
Nationality |
|
Saudi |
22 35 |
Non-Saudi |
41 65 |
Qualification |
|
PhD |
24 38 |
Master |
32 51 |
Others |
7 11 |
Place of obtaining qualification |
|
America |
13 20 |
Europe |
17 27 |
Arab countries |
24 38 |
Other Places |
9 15 |
Job Status |
|
Academics and Consultants |
15 24 |
Senior Specialists |
11 17.5 |
Specialists |
26 41 |
Residents |
11 17.5 |
Table 1: Demographic data of respondent (N=63)
SN |
Types of bracket |
N |
% |
1 |
3M Unit |
28 |
44.4 |
2 |
TP Ortho |
2 |
3.2 |
3 |
American |
20 |
31.7 |
4 |
Ormco |
6 |
9.5 |
5 |
GAC |
3 |
4.8 |
6 |
Ortho te |
1 |
1.6 |
7 |
I used b |
1 |
1.6 |
8 |
Ortho cl |
1 |
1.6 |
9 |
Dentawru |
1 |
1.6 |
Table 2: The commonly used bracket by the orthodontists
SN |
Reason of orthodontic bracket purchase |
N |
% |
1 |
Using it as an orthodontic student (Resident) and liked it |
19 |
30.2 |
2 |
Quality of the Bracket |
26 |
41.3 |
3 |
Customer Service |
4 |
6.3 |
4 |
Ease of use |
8 |
12.7 |
5 |
Cost |
4 |
6.3 |
6 |
Being used by the practice |
1 |
1.6 |
7 |
Popularity |
1 |
1.6 |
Table 3: Reason of orthodontists purchase brackets from a specific company
Used |
PhD |
Master |
Others |
Chi-Sqire (P value) |
No (%) |
No (%) |
No (%) |
||
Self-ligating |
19 (79.1) |
24 (75.0) |
6 (85.7) |
0.809 |
Clear aligner therapy: Invisalgin |
9 (37.5) |
15 (46.8) |
5 (71.4) |
0.282 |
TADs |
19 (79.1) |
21 (65.6) |
6 (85.7) |
0.383 |
Cone-beam computerized tomography |
20 (83.3) |
26 (81,2) |
2 (28.5) |
0.007* |
Digital imaging |
22 (91.6) |
26 (81.2) |
6 (85.7) |
0.545 |
Indirect bonding |
22 (91.6) |
18 (56.2) |
3 (42.8) |
0.006* |
Lingual Orthodontics |
19 (79.1) |
10 (31.2) |
1 (14.2) |
0.000* |
2-phase treatment |
23 (95.8) |
27 (84.3) |
5 (71.4) |
0.181 |
Functional appliance |
23 (95.8) |
32 (100) |
3 (42.8) |
0.000* |
Table 4: Orthodontics used according to qualification
Used |
Academic & Consultant |
Seni-Spec N = 11 |
Specialist N = 26 |
Resident & GP |
Chi-Sqire (P value) |
No (%) |
No (%) |
No (%) |
No (%) |
||
Self-ligating |
13 (86.6) |
9 (81.8) |
20 (76.9) |
7 (63.6) |
0.557 |
Clear aligner therapy: Invisalgin |
7 (46.6) |
3 (27.2) |
12 (46.1) |
7 (63.6) |
0.402 |
TADs |
12 (80.0) |
9 (81.8) |
17 (65.3) |
8 (72.7) |
0.666 |
Cone-beam computerized tomography |
13 (86.6) |
8 (72.7) |
21 (80.7) |
6 (54.5) |
0.249 |
Digital imaging |
14 (93.3) |
10 (90.9) |
21 (80.7) |
9 (81.8) |
0.657 |
Indirect bonding |
14 (93.3) |
9 (81.8) |
18 (69.2) |
2 (18.1) |
0.000* |
Lingual Orthodontics |
11 (73.3) |
8 (72.7) |
11 (42.3) |
0 (0.0) |
0.001* |
2-phase treatment |
13 (86.6) |
11 (100) |
23 (88.4) |
8 (72.7) |
0.290 |
Functional appliance |
15 (100) |
10 (90.9) |
25 (96.1) |
8 (72.7) |
0.057 |
Table 5: Orthodontics used according to Professional classification
* Significant at the level of P<05
Used |
America N = 13 |
Europe N = 17 |
Arab Countries N = 24 |
Other Countries |
Chi-Sqire |
N (%) |
N (%) |
N (%) |
N (%) |
||
Self-ligating |
10 (76.9) |
13 (76.4) |
17 (70.8) |
9 (100) |
0.353 |
Clear aligner therapy: Invisalgin |
2 (15.3) |
11 (64.7) |
11 (45.8) |
5 (55.5) |
0.054 |
TADs |
8 (61.5) |
14 (82.3) |
18 (75.0) |
6 (66.6) |
0.603 |
Cone-beam computerized tomography |
11 (84.6) |
15 (88.2) |
17 (70.8) |
5 (55.5) |
0.225 |
Digital imaging |
12 (92.3) |
17 (100) |
17 (70.8) |
8 (88.8) |
0.052 |
Indirect bonding |
12 (92.3) |
12 (70.5) |
13 (54.1) |
6 (66.6) |
0.126 |
Lingual Orthodontic |
12 (92.3) |
11 (64.7) |
6 (25.0) |
1 (11.1) |
0.000* |
2-phase treatment |
12 (92.3) |
17 (100) |
18 (75.0) |
8 (88.8) |
0.109 |
Functional appliance |
12 (92.3) |
17 (100) |
20 (83.3) |
9 (100) |
0.191 |
Table 6: Orthodontics used according to place of qualification
*Significant at the level of P<05