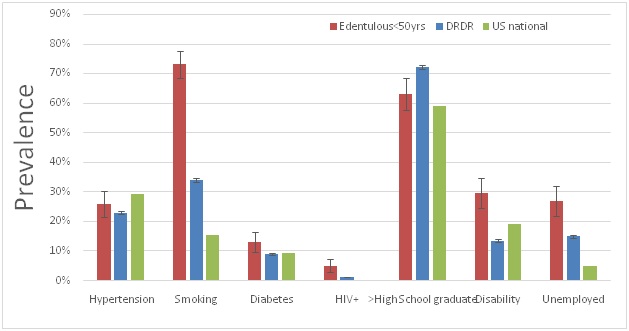
Figure 1 Prevalence differences based on ethnicity and sex. Prevalence values shown for the edentulous population younger than 50 years old and for DRDR records. Standard error bars shown. P<0.05 for Whites and males.
Figure 1 Prevalence differences based on ethnicity and sex. Prevalence values shown for the edentulous population younger than 50 years old and for DRDR records. Standard error bars shown. P<0.05 for Whites and males.
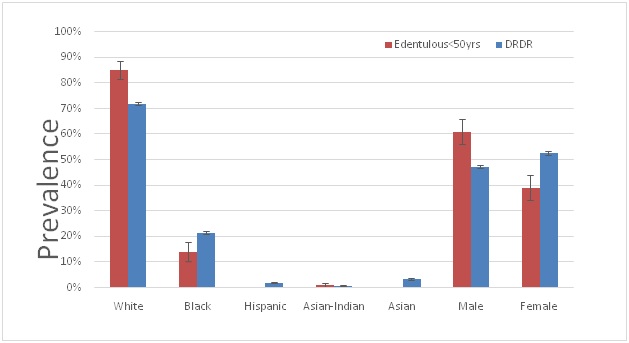
Figure 2 Prevalence differences based on ethnicity and sex. Prevalence values shown for the edentulous population younger than 50 years old and for DRDR records. Standard error bars shown. P<0.05 for Whites and males.
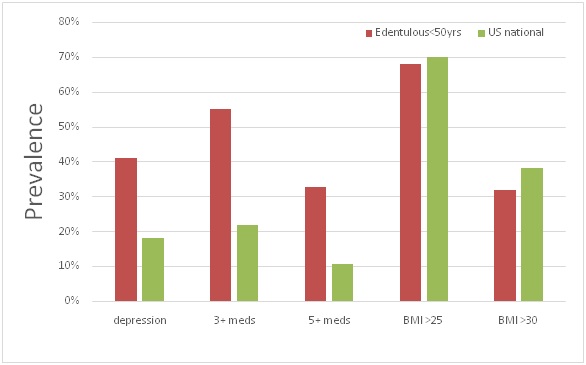
Figure 3 Prevalence of depression, patients taking 3+ and 5+ meds, and patients with BMI greater than 25 and greater than 30. Differences in prevalence shown between the edentulous population younger than 50 years of age and US national values.