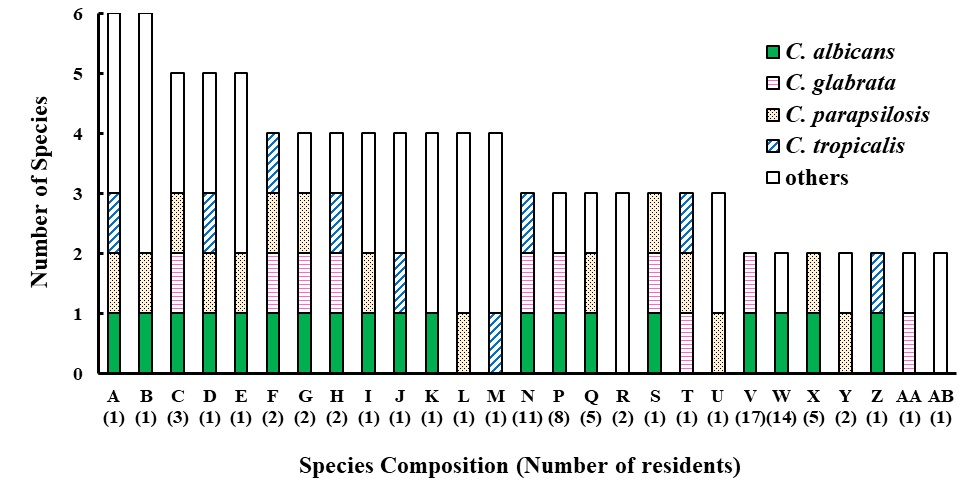
Figure 1 Distribution of species composition of residents colonized by multiple species.
Figure 1 Distribution of species composition of residents colonized by multiple species.
Characteristics |
Total (N = 204) |
Colonized by Yeast(N = 158) |
Not-colonized by Yeast N = 46) |
Univariate |
Multivariate |
|||
mean |
SD |
mean |
SD |
mean |
SD |
p value |
p value, OR (95% CI) |
|
Age, years (mean ± SD) |
77.1 |
9.73 |
78.4 |
9.17 |
72.7 |
10.37 |
<0.001 |
|
BMI |
22.7 |
3.58 |
22.6 |
3.63 |
23.0 |
3.43 |
0.451 |
|
Number of missing teeth |
15.8 |
10.13 |
16.5 |
10.30 |
13.3 |
9.21 |
0.06 |
|
Number of dentures |
10.8 |
10.97 |
12.1 |
11.28 |
6.2 |
8.42 |
<0.001 |
0.008, 1.06 (1.015-1.107) |
|
No. |
% |
No. |
% |
No. |
% |
p value |
|
Female |
106 |
52 |
88 |
55.7 |
18 |
39.1 |
0.048 |
0.974, 0.987 (0.447-2.178) |
Age > 70 years |
153 |
75 |
124 |
78.5 |
29 |
63 |
0.033 |
0.949, 1.027 (0.454-2.324) |
Education |
|
|
|
|
|
|
0.815 |
|
None |
27 |
13.2 |
22 |
13.9 |
5 |
10.9 |
|
|
Elementary School |
99 |
48.5 |
74 |
46.8 |
25 |
54.3 |
|
|
Junior High School |
32 |
15.7 |
26 |
16.5 |
6 |
13 |
|
|
High School |
28 |
13.7 |
23 |
14.6 |
5 |
10.9 |
|
|
College or above |
18 |
8.8 |
13 |
8.2 |
5 |
10.9 |
|
|
Wheelchair use |
57 |
27.9 |
42 |
26.6 |
15 |
32.6 |
0.423 |
|
Smoking |
18 |
8.8 |
15 |
9.5 |
3 |
6.5 |
0.905 |
|
Betel nut chewing |
6 |
2.9 |
2 |
1.3 |
4 |
8.7 |
0.001 |
0.081, 0.183 (0.027-1.236) |
Frequency of brushing teeth > once a day |
112 |
54.9 |
94 |
59.5 |
18 |
39.1 |
0.015 |
0.257, 1.55 (0.726-3.309) |
Mouthwash |
51 |
25 |
39 |
24.7 |
12 |
26.1 |
0.847 |
|
Dry mouth |
75 |
36.8 |
61 |
38.6 |
14 |
30.4 |
0.312 |
|
Periodontal disease and/or Tartar |
127 |
62.3 |
92 |
58.2 |
35 |
76.1 |
0.028 |
0.238, 0.598 (0.254-1.406) |
Chronic disease |
163 |
79.9 |
132 |
83.5 |
31 |
67.4 |
0.027 |
0.078, 2.155 (0.916-5.062) |
Hypertension |
91 |
44.6 |
72 |
45.6 |
19 |
41.3 |
0.609 |
|
Diabetes mellitus |
46 |
22.5 |
40 |
25.3 |
6 |
13 |
0.08 |
|
Heart disease |
35 |
17.2 |
28 |
17.7 |
7 |
15.2 |
0.692 |
|
Osteoporosis |
14 |
6.9 |
11 |
7 |
3 |
6.5 |
1 |
|
Stroke |
12 |
5.9 |
9 |
5.7 |
3 |
6.5 |
0.735 |
|
Gout |
10 |
4.9 |
8 |
5.1 |
2 |
4.3 |
1 |
|
Arthritis |
10 |
4.9 |
10 |
6.3 |
0 |
0 |
0.121 |
|
Kidney disease |
4 |
2 |
3 |
1.9 |
1 |
2.2 |
1 |
|
Taking medicine |
143 |
70.1 |
115 |
72.8 |
28 |
60.9 |
0.245 |
|
No, number. |
||||||||
Table 1: Risk factors of residents colonized by yeasts
Characteristics |
Total |
More than one species (N=88) |
One species (N=70) |
Univariate |
Multivariate |
|||
mean |
SD |
mean |
SD |
mean |
SD |
p value |
p value, OR (95% CI) |
|
Age |
78.4 |
9.17 |
79.8 |
8.75 |
76.7 |
9.44 |
0.032 |
|
BMI |
22.6 |
3.63 |
22.5 |
3.76 |
22.7 |
3.48 |
0.793 |
|
Number of missing teeth |
16.5 |
10.30 |
16.4 |
10.35 |
16.7 |
10.31 |
0.847 |
|
Number of dentures |
12.1 |
11.28 |
12.7 |
11.31 |
11.5 |
11.29 |
0.504 |
|
|
No. |
% |
No. |
% |
No. |
% |
p value |
|
Yeast CFU > 10 |
117 |
74.1 |
78 |
88.6 |
39 |
55.7 |
<0.001 |
0.001, 6.156 (2.709–13.989) |
Female |
88 |
55.7 |
52 |
59.1 |
36 |
51.4 |
0.335 |
|
Age > 70 |
124 |
78.5 |
75 |
85.2 |
49 |
70 |
0.021 |
0.037, 2,435 (1.057–5.607) |
Education |
|
|
|
|
|
|
0.675 |
|
None |
22 |
13.9 |
14 |
15.9 |
8 |
11.4 |
|
|
Elementary school |
74 |
46.8 |
41 |
46.6 |
33 |
47.1 |
|
|
Junior high school |
26 |
16.5 |
16 |
18.2 |
10 |
14.3 |
|
|
High school |
23 |
14.6 |
10 |
11.4 |
13 |
18.6 |
|
|
College or above |
13 |
8.2 |
7 |
8 |
6 |
8.6 |
|
|
Wheelchair use |
42 |
26.6 |
25 |
28.4 |
17 |
24.3 |
0.56 |
|
Smoking |
15 |
9.5 |
8 |
9.1 |
7 |
10 |
1 |
|
Betel nut chewing |
2 |
1.3 |
1 |
1.1 |
1 |
1.4 |
1 |
|
Frequency of brushing teeth > once a day |
94 |
59.5 |
48 |
54.5 |
46 |
65.7 |
0.155 |
|
Mouthwash |
39 |
24.7 |
21 |
23.9 |
18 |
25.7 |
0.789 |
|
Dry mouth |
61 |
38.6 |
35 |
39.8 |
26 |
37.1 |
0.736 |
|
Periodontal Disease and/or tartar |
92 |
58.2 |
51 |
58 |
41 |
58.6 |
0.938 |
|
Chronic disease |
132 |
83.5 |
76 |
86.4 |
56 |
80 |
0.273 |
|
Hypertension |
72 |
45.6 |
41 |
46.6 |
31 |
44.3 |
0.773 |
|
Diabetes mellitus |
40 |
25.3 |
22 |
25 |
18 |
25.7 |
0.918 |
|
Heart disease |
28 |
17.7 |
17 |
19.3 |
11 |
15.7 |
0.556 |
|
Osteoporosis |
11 |
7 |
8 |
9.1 |
3 |
4.3 |
0.348 |
|
Arthritis |
10 |
6.3 |
4 |
4.5 |
6 |
8.6 |
0.34 |
|
Stroke |
9 |
5.7 |
5 |
5.7 |
4 |
5.7 |
1 |
|
Gout |
8 |
5.1 |
4 |
4.5 |
4 |
5.7 |
0.733 |
|
Kidney disease |
3 |
1.9 |
1 |
1.1 |
2 |
2.9 |
0.585 |
|
Taking medicine |
115 |
72.8 |
68 |
77.3 |
47 |
67.1 |
0.25 |
|
No, number. |
||||||||
Table 2: Risk factors of residents colonized by multiple species