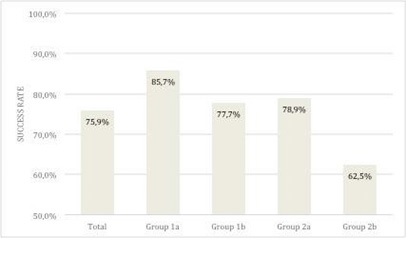
Figure 1 Presentation of the clinical survival rates depending on the chosen treatment concept within the patient groups.
Figure 1 Presentation of the clinical survival rates depending on the chosen treatment concept within the patient groups.
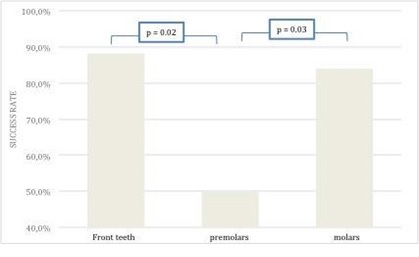
Figure 2 Clinical success rate of all included roots depending on the tooth position. Mean follow-up intervals = 17.5 months for anterior teeth, 14.2 months for premolars and 13.5 months for molars.
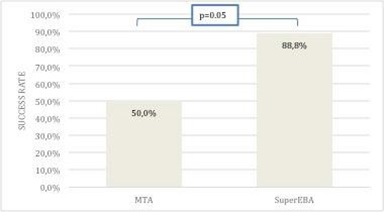
Figure 3 Clinical success rate of root tip resection depending on the material used for retrograde root filling.
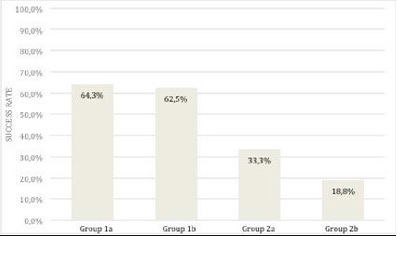
Figure 4 Radiological outcome of the treatment success within the patient groups taking into account the radiographic PAI evaluation.
Group |
Teeth/roots |
Front teeth |
Premolars |
Molars |
Clinical success rate |
Radiological success rate |
1a |
n=14/n=14 |
n=6 |
n=7 |
n=1 |
85.7% |
64.3% |
1b |
n=8/n=9 |
n=3 |
n=2 |
n=4 |
77.7% |
62.5% |
2a |
n=15/n=19 |
n=4 |
n=6 |
n=9 |
78.9% |
33.3% |
2b |
n=11/n=16 |
n=4 |
n=1 |
n=11 |
62.5% |
18.8% |
total |
n=48/n=58 |
n=17 |
n=16 |
n=25 |
75.9% |
42.0% |
Table 1: Showing the patient cohort and related outcomes