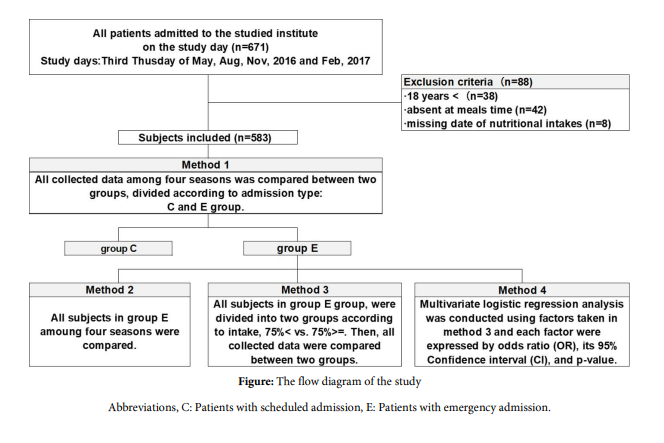
Figure 1: The flow diagram of the study Abbreviations, C: Patients with scheduled admission, E: Patients with emergency admission.
Collected Data |
Timing of Measuring |
|||
At Admission |
During Admission |
at Discharge |
||
Demographics |
sex, age, height, body weight, BMI, Clinical department |
● |
|
|
|
CCI score, ADL score, type of admission; C or E |
● |
|
|
|
length between admission and study day |
|
● |
|
Nutritional Parameters |
% average food intake, Lunch; presence or absence |
|
● |
|
|
IDDSI classification of lunch texture |
|
● |
|
Outcome parameters |
|
|
|
|
Primary outcome |
In-hospital mortality |
|
|
● |
Secondary outcomes |
LOS, highest CRP during the entire hospital study |
|
|
● |
|
dead during admission within 30 days, discharge being home |
|
|
● |
Table 1: Timeline of the data collection
Abbreviations, ADL: Activity of Daily Living, BMI: Body Mass Index, C: Scheduled admission, CCI: Charlson Comorbidity Index,CRP: C-reactive protein, E: Emergency admission, ICD: International Statistical Classification of Diseases and Related Health Problems,
IDDSI: International Dysphagia Diet Standardisation Initiative, LOS: Length of stay in hospital.
|
Method 1 |
|||
Total |
Group C |
Group E |
pvalue |
|
Descriptions |
|
|
|
|
Number of subjects |
583 |
365 |
218 |
|
Length between admission and study day, days |
9 (3, 20) |
8 (2, 16) |
10 (4, 23) |
< 0.001 |
Sex, male, N (%) |
310 (53) |
187 (51) |
123 (56) |
0.224 |
Age, years |
74 (66, 80) |
72 (64,78) |
78 (69, 83) |
< 0.001 |
Body weight, kg |
55.2 (47.0, 63.2) |
56.9 (48.7, 64.6) |
53.0 (44.2, 60.8) |
< 0.001 |
BMI, kg/m2 |
21.9 (19.5, 24.5) |
22.3 (19.8, 25.2) |
21.4 (18.7, 23.5) |
< 0.001 |
Primary diagnosis, N (%) |
|
|
|
< 0.001 |
Medical |
386 (66) |
222 (61) |
164 (75) |
|
Surgical |
197 (34) |
143 (39) |
54 (25) |
|
CCI score |
4 (2, 6) |
4 (2, 6) |
5 (3, 7) |
< 0.001 |
ADL score < 3, N (%) |
403 (69) |
302 (83) |
101 (46) |
< 0.001 |
Nutritional parameters |
|
|
|
|
% Food intake, N (%) |
|
|
|
0.002 |
75-100 |
333 (57) |
226 (62) |
107 (49) |
|
0-74 |
250 (43) |
139 (38) |
111 (51) |
|
IDDSI classification of lunch texture, IDDSI |
107 (23) |
32 (11) |
75 (45) |
< 0.001 |
Outcome parameters |
|
|
|
|
Primary outcome |
|
|
|
|
In-hospital mortality, N (%) |
30 (5) |
10 (3) |
20 (9) |
0.001 |
Secondary outcomes |
|
|
|
|
LOS, days |
22 (12, 43) |
20 (10, 37) |
27 (16, 47) |
< 0.001 |
Highest CRP during the entire hospital study, mg/dL |
3.3 (0.5, 10.1) |
1.7 (0.3, 6.6) |
6.7 (1.3, 14.5) |
< 0.001 |
Time between study day and day of peak CRP, days |
2 (-2, 11) |
2 (-2, 11) |
4 (-1, 11) |
0.246 |
Dead during admission within 30 days, N (%) |
10 (2) |
1 (0) |
9 (4) |
0.001 |
Discharge to home, N (%) ⁑ |
474 (86) |
326 (92) |
148 (75) |
< 0.001 |
Table 2: The comparisons of description parameters, nutritional parameters, primary and secondary outcomes of subjects divided by admis- sion type, patients with scheduled admission as control (group C) and patients with emergency admission (group E)
The age, BMI, CCI, were significantly higher and ADL were poor in group E compared with group C. The % food intake of the study days, food texture scored by IDDSI, and in-hospital mortality as the primary outcome, the length of stay (LOS), the highest CRP during the entire hospital stay, the death rate during hospitalization within 30 days, and discharge to home were significantly worse in group E compared to them in group C. Analyses with # and exclude subjects who missed lunch or died during hospitalization.
Abbreviations, ADL: Activity of Daily Living, BMI: Body Mass Index, C: Patients with scheduled admission, CCI: Charlson Comorbidity In- dex, CRP: C-reactive protein, E: Patients with emergency admission, IDDSI: International Dysphagia Diet Standardisation Initiative, LOS: Length of stay in hospital.
|
Method 2 |
||||
|
group Sp |
group Su |
group Au |
group Wi |
pValue |
Number of subjects |
50 |
50 |
68 |
50 |
|
Demographics |
|
|
|
|
|
Length between admission and study day, days |
9 (4, 29) |
10 (4, 23) |
10 (3, 22) |
15 (6, 23) |
0.915 |
Sex, male, N (%) |
28 (56) |
27 (54) |
34 (50) |
34 (68) |
0.263 |
Age, years |
79 (72, 83) |
76 (68, 82) |
78 (67, 83) |
79 (70, 82) |
0.600 |
Body weight, kg |
52.3 (42.3, |
53.0 (45.6, |
52.4 (43.1, |
54.8 (45.8, |
0.177 |
BMI, kg/m2 |
20.2 (18.3, |
21.2 (18.5, |
21.4 (18.0, |
22.2 (19.8, |
0.142 |
Medical diagnsis in primary diagnosis, N (%) |
36 (72) |
40 (80) |
51 (75) |
37 (74) |
0.817 |
CCI score |
5 (3, 7) |
5 (3, 7) |
5 (3, 7) |
5 (3, 7) |
0.970 |
ADL score < 3, N (%) |
21 (42) |
27 (54) |
32 (47) |
21 (42) |
0.596 |
Nutritional parameters |
|
|
|
|
|
% Food intake, N (%) |
|
|
|
|
0.200 |
75-100 |
23 (46) |
21 (42) |
32 (47) |
31 (62) |
|
0-74 |
27 (54) |
29 (58) |
36 (53) |
19 (38) |
|
IDDSI classification of lunch texture, IDDSI < 7, N (%)# |
19 (50) |
20 (51) |
20 (41) |
16 (39) |
0.548 |
Outcome parameters |
|
|
|
|
|
Primary outcome |
|
|
|
|
|
In-hospital mortality, N (%) |
4 (8) |
4 (8) |
9 (13) |
3 (6) |
0.630 |
Secondary outcomes |
|
|
|
|
|
LOS, days |
30 (15, 63) |
26 (18, 44) |
28 (15, 46) |
27 (19, 47) |
0.942 |
Highest CRP during the entire hospital study, mg/dL |
6.7 (1.3, 14.5) |
6.4 (1.3, 14.5) |
8.2 (1.2, 18.0) |
5.6 (1.2, 11.1) |
0.531 |
Time between study day and day of peak CRP, days |
5 (-2, 9) |
2 (-2, 13) |
2 (-1, 11) |
7 (-2, 13) |
0.874 |
Discharge to home, N (%)⁑ |
33 (72) |
36 (78) |
47 (80) |
32 (68) |
0.497 |
Table 3: The comparison of description parameters, nutritional parameters, primary and secondary outcome of patients with emergency ad- mission in four seasons
All description parameters of patients with emergency admission in four seasons were not significantly different. The % food intake of the study days, food texture scored by IDDSI, and in-hospital mortality as the primary outcome, the length of stay (LOS), the highest CRP during the entire hospital stay, the death rate during hospitalization within 30 days, and discharge to home were not significantly different. Analyses with # and exclude subjects who missed lunch or died during hospitalization.
Abbreviations, ADL: Activity of Daily Living, BMI: Body Mass Index, CCI: Charlson Comorbidity Index, CRP: C-reactive protein, IDDSI: In- ternational Dysphagia Diet Standardisation Initiative, LOS: Length of stay in hospital.
|
Method 3-1 |
Method 3-2 |
||||
All Intake 75% >= |
All Intake 75% < |
pValue |
All Intake 50% >= |
All Intake 50% < |
pValue |
|
Number of subjects |
107 |
111 |
|
150 |
68 |
|
Nutritional parameters |
|
|
|
|
|
|
% Food intake, N (%) |
|
|
|
|
|
|
All |
98 (88, 100) |
33 (0, 59) |
< 0.001 |
88 (68, 100) |
0 (0, 27) |
< 0.001 |
Staple food: Rice and bread |
100 (90, |
33 (0, 53) |
< 0.001 |
93 (67, 100) |
0 (0, 23) |
< 0.001 |
Side dish: meat, fish, fruits and vegetables |
97 (87, 100) |
32 (0, 63) |
< 0.001 |
90 (70, 100) |
0 (0, 23) |
< 0.001 |
#IDDSI classification of lunch texture, N (%) |
|
|
0.101 |
|
|
0.037 |
IDDSI = 7 |
64 (60) |
28 (47) |
|
83 (59) |
9 (36) |
|
IDDSI < 7 |
43 (40) |
32 (53) |
|
59 (42) |
16 (64) |
|
Outcome parameters |
|
|
|
|
|
|
Primary outcome |
|
|
|
|
|
|
In-hospital mortality, N (%) |
1 (1) |
19 (17) |
< 0.001 |
2 (1) |
18 (27) |
< 0.001 |
Secondary outcomes |
|
|
|
|
|
|
LOS, days |
22 (14, 45) |
32 (18, 50) |
0.017 |
22 (15, 44) |
42 (21, 60) |
0.001 |
Highest CRP during the entire hospital study, mg/dL |
2.6 (0.5, |
9.1 (4.6, |
< 0.001 |
4.1 (0.7, |
10.4 (6.6, |
< 0.001 |
Dead during admission within 30 days , N (%) |
0 (0) |
9 (8) |
0.002 |
0 (0) |
9 (13) |
< 0.001 |
Discharge to home, N (%) ⁑ |
84 (79) |
64 (70) |
0.118 |
117 (79) |
31 (62) |
0.016 |
Table 4: Comparisons of nutritional parameters, primary and secondary outcomes of ED patients divided into two methods. One was all ED patients divided into two subgroups by % of hospital food, >= 75% and < 75% (method 3-1). The other was all ED patients divided into two subgroups by % of hospital food, >= 50% and < 50% (method 3-2)
In both results of method 3-1 and 3-2, food intake, food texture scored by IDDSIS, and in-hospital mortality as the primary outcome mea- sure, as well as length of stay (LOS), highest CRP during the entire hospital stay, in-hospital mortality within 30 days, and discharge to home were significantly different. In other words, these results are interpreted to mean that patients with emergency admission summed over four seasons had a poor outcome if they had significantly lower hospital food intake < 75% and < 50% of requirement. To identify these patients with significantly higher in-hospital mortality earlier, the cut-off value of daily food intake is appropriately set at 75%. Analyses with # and ex- clude subjects who missed lunch or died during hospitalization.
Abbreviations, CRP: C-reactive protein, ED: emergency departments, IDDSI: International Dysphagia Diet Standardisation Initiative, LOS: Length of stay in hospital.
Variables |
Method 4 |
||
Reference |
OR (95% CI) |
pValue |
|
Sex |
female |
2.119 (0.640-6.993) |
0.219 |
Age |
|
1.020 (0.963-1.081) |
0.497 |
BMI |
|
0.948 (0.824-1.091) |
0.456 |
Department |
surgery |
3.876 (0.679-22.222) |
0.127 |
CCI |
|
1.083 (0.912-1.286) |
0.365 |
ADL |
score 3 < |
1.067 (0.328-3.466) |
0.915 |
% Food intake |
|
0.616 (0.496-0.766) |
< 0.001 |
Table 5: Results of multivariate regression analysis to identify ED patients with suspected high in-hospital mortality
Among the six variants analyzed, % of food intake was a significant OR with a significant p-value.
Abbreviations, ADL: Activity of Daily Living, BMI: Body Mass Index, CCI: Charlson Comorbidity Index, CI: confidence interval, ED: emer- gency departments, OR: odds ratio.
|
Groups in method 1 |
||||
Total |
group C |
group E |
pValue |
||
ICD-10 Version:2016,N(%) |
|
|
|
|
|
Number of subjects |
|
583 |
365 |
218 |
|
Categories |
Title |
|
|
|
|
I |
Certain infectious and parasitic diseases |
15 (3) |
2 (1) |
13 (6) |
< 0.001 |
II |
Neoplasms |
83 (14) |
42(12) |
41 (19) |
0.015 |
III |
Diseases of the blood and blood-forming organs and certain disorders involving the immune |
2 (0) |
1 (0) |
1 (0) |
0.608 |
IV |
Endocrine, nutritional and metabolic diseases |
53 (9) |
43 (12) |
10 (5) |
0.003 |
V |
Mental and behavioural disorders |
2 (0) |
0 (0) |
2 (1) |
0.139 |
VI |
Diseases of the nervous system |
43 (7) |
29 (8) |
14 (6) |
0.469 |
VII |
Diseases of the eye and adnexa |
32 (5) |
30 (8) |
2 (1) |
< 0.001 |
IX |
Diseases of the circulatory system |
48 (8) |
21 (6) |
27 (12) |
0.005 |
X |
Diseases of the respiratory system |
22 (4) |
5 (1) |
17 (8) |
< 0.001 |
XI |
Diseases of the digestive system |
48 (8) |
21 (6) |
27 (12) |
0.005 |
XII |
Diseases of the skin and subcutaneous tissue |
3 (1) |
2 (1) |
1 (0) |
0.685 |
XIII |
Diseases of the musculoskeletal system and connective tissue |
66 (11) |
54 (15) |
12 (5) |
0.001 |
XIV |
Diseases of the genitourinary system |
57 (10) |
36 (10) |
21 (10) |
0.928 |
XVII |
Congenital malformations, deformations and chromosomal abnormalities |
1 (0) |
0 (0) |
1 (0) |
0.374 |
XVIII |
Symptoms, signs and abnormal clinical and laboratory findings, not elsewhere classified |
5 (1) |
3 (1) |
2 (1) |
0.617 |
XIX |
Injury, poisoning and certain other consequences of external causes |
30 (5) |
11 (3) |
19 (9) |
0.003 |
XXI |
Factors influencing health status and contact with health services |
73 (12) |
65 (18) |
8 (4) |
< 0.001 |
Supplemental Table: Comparison of ICD-10 of the two groups; control vs. emergency group
Figure 1: The flow diagram of the study Abbreviations, C: Patients with scheduled admission, E: Patients with emergency admission.
Tables at a glance
Figures at a glance