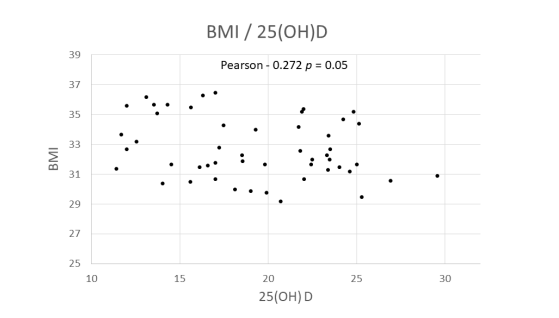
Figure 1: Negative correlation between BMI and 25 (OH)D
Figure 1: Negative correlation between BMI and 25 (OH)D
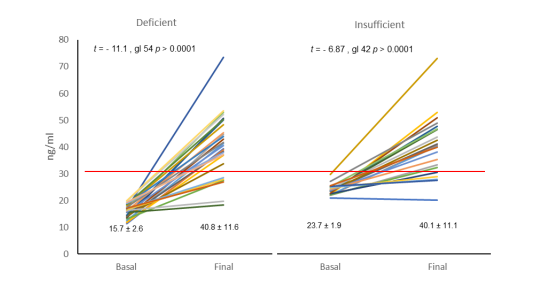
Figure 2: Behavior of Vitamin D3 levels after 90 days of supplementation in insufficient and deficient patients
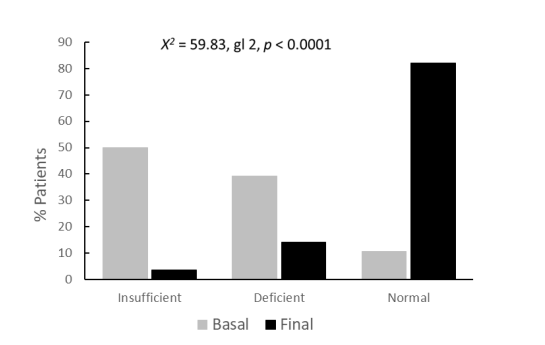
Figure 3: Modification of vitamin D3 level
Tables at a glance
Figures at a glance