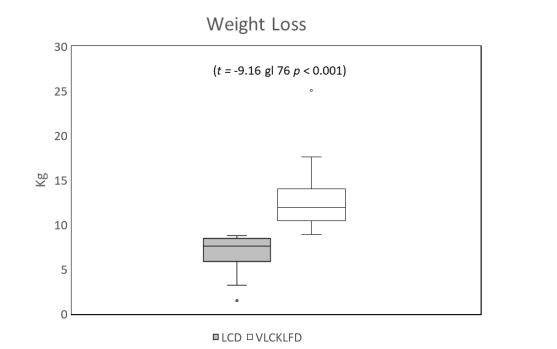
Figure 1: This figure shows the difference in weight loss at the end of the study
Figure 1: This figure shows the difference in weight loss at the end of the study
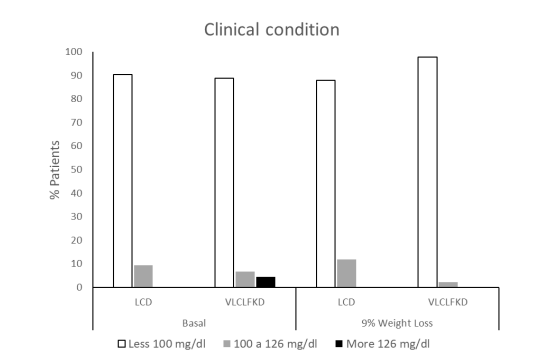
Figure 2: In this graph, the modification in the percentage of patients with normal glucose levels, prediabetics, and diabetics can be appreciated at the beginning and when they reached a 9% weight loss
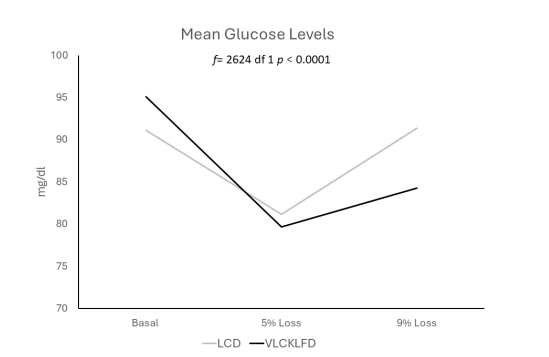
Figure 3: Comparative graph of mean glucose levels in the LCD and VLCLFKD groups. In the LCD group, a decrease in the average glucose level is observed with a 5% weight loss, followed by a recovery when patients reached a 9% loss. Conversely, in the VLCLFKD group, although there was an upward compensation, glucose levels showed a decrease. A repeated measures comparison of group behaviors was conducted, yielding highly significant results
Figures at a glance