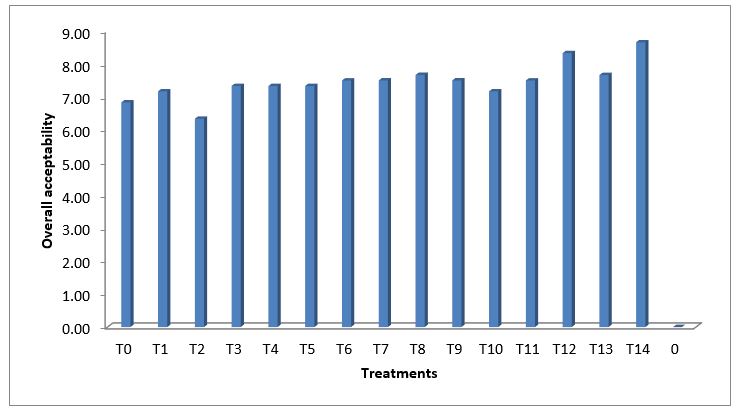
Table 1: Mean of sensory attributes of experimental developed burfi
Values are the mean of up to 3 replicates ± standard deviation (SD)
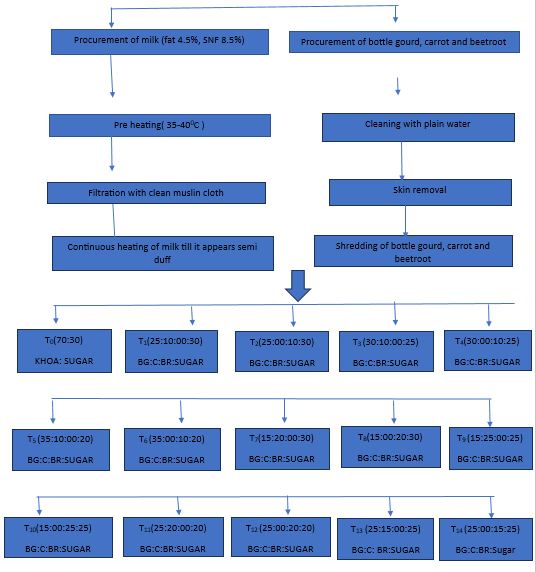
Where T0 =( khoa : sugar) 70:30 (control), T1 (Bottle gourd :carrot: beet root: sugar) = 25:10:00:30, T2 (Bottle gourd : Carrot : Beetroot : Sugar) = 25:00:10:30, T3 ( Bottle gourd : Carrot: Beetroot : Sugar) = 30:10:00:25, T4 (Bottle gourd: Carrot: Beetroot: Sugar) = 30:00:10:25, T5 (Bottle gourd: Carrot: Beetroot: Sugar) = 35:10:00:20, T6 (Bottle gourd: Carrot: Beetroot : Sugar) = 35:00:10:20 , T7 (Bottle gourd: Carrot: Beetroot: Sugar) = 15:20:00:30, T8 (Bottle gourd : Beetroot: Carrot: Sugar) = 15:00:20:30, T9 (Bottle gourd: Carrot: Beetroot: Sugar) = 15:25:00:25, T10 (Bottle gourd: Carrot: Beetroot: Sugar) = 15:00:25:25, T11 (Bottle gourd: Carrot: Beetroot: Sugar) = 25:20:00:20, T12 (Bottle gourd: Carrot: Beetroot: Sugar) = 25:00: 20:20, T13 ( Bottle gourd: Carrot: Beetroot: Sugar) = 25:15:00:25 and T14 (Bottle gourd: Carrot: Beetroot) = 25:00:15:25.
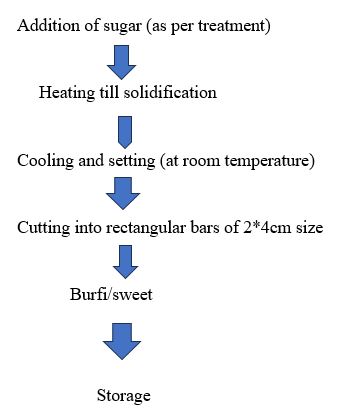
Flow chart for Experimental Developed Burfi
Figure 2
Tables at a glance
Figures at a glance