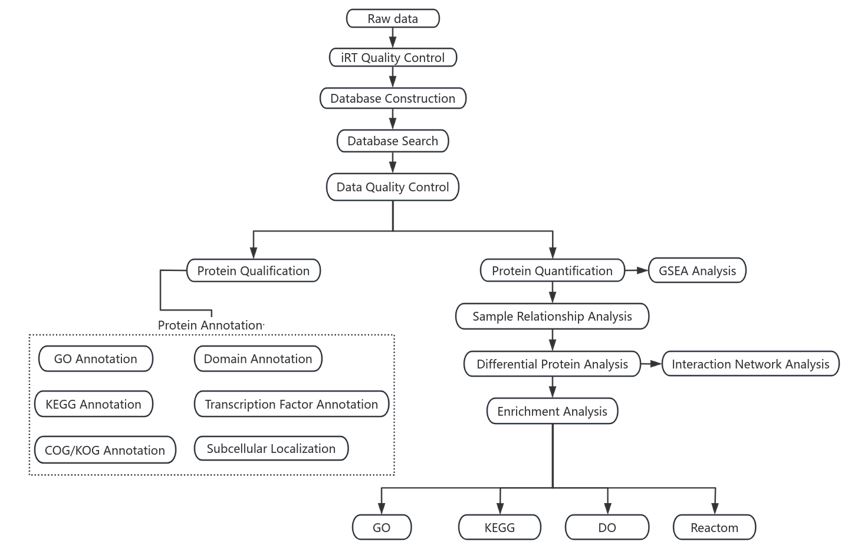
Figure 1: Proteome construction process
Figure 1: Proteome construction process
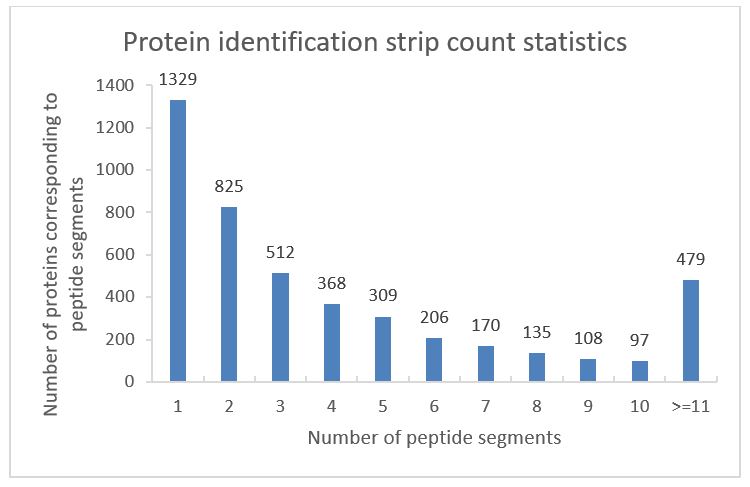
Table 1: Statistical table of protein identification
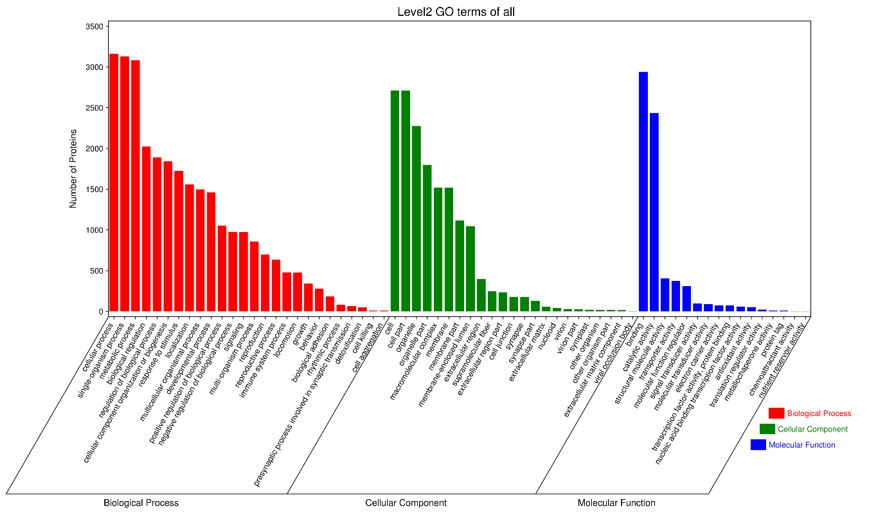
Figure 2: GO function annotation classification statistics
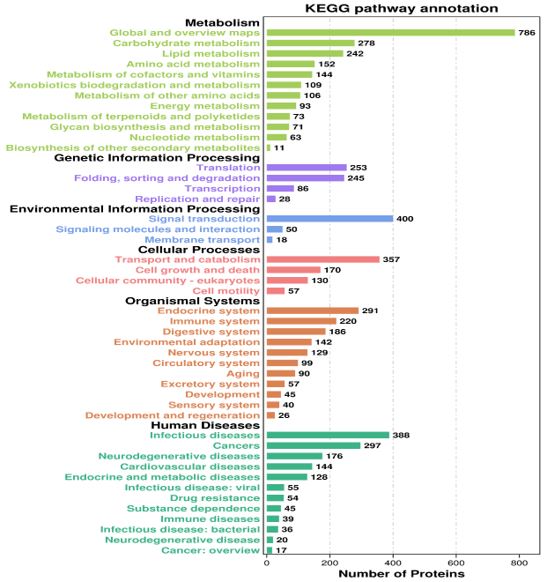
Figure 3: Statistics of KEGG protein metabolism pathway
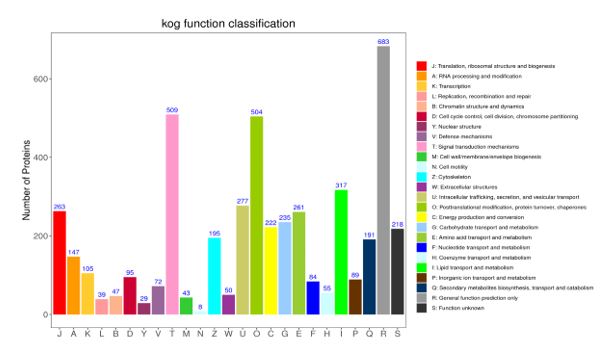
Figure 4: Classification statistics of KOG enrichment function
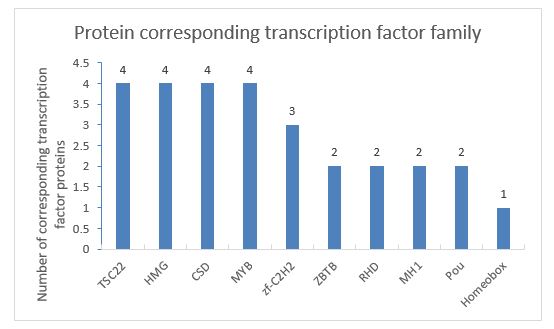
Figure 5: Transcription factor family statistics
Tables at a glance
Figures at a glance