A Folic Acid Sensor with a Molecularly Imprinted Chitosan Polymer Membrane Coated on an Optical Core Surface as a Transducer
Received Date: April 30, 2025 Accepted Date: May 30, 2025 Published Date: June 02, 2025
doi: 10.17303/jfn.2025.11.202
Citation: Ricardo Mendoza, Shiquan Tao (2025) A Folic Acid Sensor with a Molecularly Imprinted Chitosan Polymer Membrane Coated on an Optical Core Surface as a Transducer. J Food Nutr 11: 1-13
Abstract
An optical fiber folic acid (FA) sensor using a molecularly imprinted Chitosan membrane coated on the surface of a bent optical fiber probe (BOFP) as a transducer has been developed and tested for detecting FA in vitamin B supplemental products. The molecularly imprinted polymer (MIP) was made by crosslinking Chitosan polymer molecules with glutaraldehyde as crosslinker and FA as a template. A MIP membrane was fabricated on surface of a BOFP by coating a Chitosan MIP solution on BOFP surface and gelatinizing at ambient air environment. After washing out the template FA molecules, the MIP membrane formed on BOFP surface can selectively absorb/extract FA from a sample solution. The FA molecules extracted into the MIP membrane was detected by passing a light beam through the BOFP and detecting evanescent wave optical absorption spectrometric signal. The sensor’s response is reversible because the process of MIP membrane extracting FA is a reversible process. This sensor detects FA’s intrinsic optical absorption signal as a sensing signal, no chemical reaction is involved in the detection process and no chemical reagent is needed in the sample analysis. The MIP’s selective extracting FA into the membrane increases the sensor’s sensitivity and selectivity. The sensor achieved a detection limit of 26 ng/mL, which is much lower than traditional UV/Vis absorption spectrometric method for detecting this compound. The developed sensor has been used for analyzing FA in a vitamin B supplemental product and obtained analytical results agree well with claimed concentration of the compound in the commercial product. A standard addition/recovery test was also performed and obtained recovery rate ranged from 100% to 104%%. These test results demonstrate the feasibility of using the developed sensor for analyzing FA in commercial Vitamin B supplemental products.
Keyword: Folic Acid; Vitamin B9; Molecularly Imprinted Polymer; Evanescent Wave Optical Fiber Chemical Sensor; Solid Phase Microextraction; Vitamin B50 Complex
1. Introduction
Folic acid (FA) with an IUPAC name of 2S)-2-[(4-{[(2-amino-4-hydroxypteridin-6- yl)methyl]amino} phenyl)formamido]pentanedioic acid is one member of the vitamin B family. It is also known as vitamin B9. This compound plays significant role in keeping our health.
Vitamin B9 deficiency causes anemia with many symptoms, including shortness of breath, fantigue/weakness, pale skin, mouth ulcer, irritability and depression [1-3]. Food source of vitamin B9 include dark green leafy vegetables, beans, peas, nuts and citrus fruits [3-6].
However, many people do not take enough these food materials to provide essential quantity of vitamin B9 their body needed. One approach to address the vitamin B9 deficiency issue is adding FA to food products, the so-called fortification program [6-8]. Vitamin B9 added food products made from fortified wheat flour, rice, corn, are available from market now. Another source of vitamin B9 is the vitamin B supplemental tablet, such as vitamin B50, vitamin B100 tablet, which are also available from pharmacy stores.
Due to FA’s significant role in food products to keep human health, advanced analytical technologies are needed to analyzing vitamin B9 concentrations in difference samples, including blood, urine, natural food products, fortified food products and vitamin supplemental products [9-16]. Vitamin B9 concentration information in these samples are important for medical diagnosis, dietary planning/management as well as in quality control/insurance in food processing. FA concentration in a sample of simple sample matrix can be analyzed based on this compound’s optical or electrochemical properties [9-11]. FA absorbs UV light which can be used to analyze its concentration in samples with simple matrix [9,10]. FA can be oxidized on an electrode, which generates a current signal for quantitative analyzing this compound in a sample solution of simple matrix [11]. For analyzing vitamin B9 in samples of complex matrices, such as blood, urine, natural food materials, fortified grain products, vitamin supplemental pills, a separation procedure is needed to isolate this compound from sample matrix before detecting its concentration with a selected optical absorption spectrometry or electrochemical detection method. HPLC is the most frequently used technique for separating FA from sample matrix [12-16]. With HPLC analyzing FA in a solid food material sample, FA is normally first extracted from the solid food sample into a buffered aqueous solution and separated from the solid sample material [12-16]. The obtained buffered aqueous sample solution is then injected into a HPLC column for separation. Elution with a mixture of methanol and pH buffered aqueous solution or gradient elution method with gradually increasing polar solvent (water or pH buffered aqueous solution) concentration in mobile phase are usually adopted. The detection techniques used after HPLC separation include UV/Vis absorption spectrometry [12,13], fluorescence spectrometry [17], electrochemical detector [14], and mass spectrometry [15,16]. HPLC has been reported successfully analyzing FA in enriched cereal- grain, wheat flour, multivitamin tablet, fortified fruit juice, pharmaceutical preparations with satisfactory sensitivity and precision. However, HPLC is expensive in both instrument investment and consumable reagents. It is also time consuming, requires a well-trained scientist to operate the instrument in an environment well controlled laboratory. In many applications, a simple, low cost, field deployable and quick technique is desired for analyzing this compound extracted into an aqueous solution from a sample.
We have been developing low cost optical fiber chemical sensor (OFCS) techniques for chemical/biochemical sensing applications [18-23]. In recent developments we integrated molecularly imprinted polymer (MIP) with evanescent wave (EW) optical absorption spectrometry into OFCS to develop a selective and highly sensitive sensor for quick detecting aspirin in pharmaceutical products [24]. MIP is a polymer having specific vacant with shape and bonding sites complemental to a target compound on the inner surface of the vacant for selectively extracting a target compound from a liquid sample. MIP is synthesized by crosslinking a monomer compound by a crosslinker reagent in the existence of a template molecule. After the crosslinking reaction, the template molecules embedded inside the formed polymer. These template molecules can be washed out, which lefts behind vacant within the polymer that have shape and bonding site complemental to the template molecules. Figure 1 diagrammatically shows the process of forming a Chitosan MIP by crosslinking Chitosan macromolecules with glutaraldehyde as crosslinking agent and FA as a template. This graph also shows the processes of washing out and selective re-absorption of template molecules (FA). MIP was used as a solid phase microextraction (SPME) media in our developed aspirin sensor to selectively extract/concentrate aspirin from a sample solution [24]. MIP has also been used as a preconcentration/separation media in analyzing trace organic compounds in complex environmental samples [25,26].
In a MIP-EW-OFCS of this work, a MIP membrane is coated on surface of a bent optical fiber probe (BOFP). The MIP membrane extracts/concentrates an analyte from a sample solution. The analyte compound concentrated into the MIP membrane is then detected by passing a light beam through the BOFP, and the intrinsic optical absorption spectrometric signal of the analyte is detected as a sensing signal. Thus, an MIP-EW-OFCS integrates SPME separating/concentrating analyte from sample solution and detecting the concentrated analyte into one single specially designed BOFP. The MIP-EW-OFCS developed in this work for detecting FA achieved a detection limit of 26 ng/mL, which is much lower than the detection limit of reported UV/Vis spectrometry and HPLC/UV optical absorption spectrometric methods [9,10,12] for FA analysis. In addition, FA’s intrinsic optical absorption signal itself was detected as a sensing signal. Sample analysis using this MIP-EW-OFCS does not involve any chemical reaction, and no chemical reagent is needed in the sample analysis. It can be claimed as a green analytical technique. The sensor is reversible with a response time of 8 minutes, can be used for repeatedly detecting FA in different samples or for continuous monitoring a food processing line. In this work, the developed sensor has been used for analyzing vitamin B9 in a vitamin supplemental product (vitamin B50 complex). The obtained analytical results agree well with claimed vitamin B9 concentration in the product. A standard addition/recovery test was also performed, and the obtained recovery rate is from 100% to 104%. These real sample analysis results demonstrate the feasibility of using the developed sensor technique for real world application of analyzing vitamin B9 in vitamin supplemental products.
2. Experimental
2.1. Chemicals
Deionized (DI) water was used in preparing reagent solutions in this work. Chitosan (Chitosan from shrimp shells, Sigma-Aldrich, St. Louis, MO, USA) and glutaraldehyde (GA, OHC(CH2)3CHO, 50% aqueous solution, Sigma-Aldrich) were used as received to make Chitosan MIP. A 2% acetic acid solution was prepared by diluting concentrated acetic acid reagent (glacial acetic acid, ReagentPlus, >99%, Sigma-Aldrich) with DI water. FA has limited solubility (0.01 mg/mL) in water at ambient temperature, but has higher solubility at elevated temperature (about 10 mg/mL in boiling water) [27,28]. The solubility of this compound can also be increased by adding an acid [27]. Standard solutions of this compound used in this work were prepared by first dissolving 0.0100 grams FA (C19H19N7O6, ≥97%, Sigma-Aldrich) in 100 mL of 2% acetic acid solution at 90 oC to make a 100 µg/mL stock standard solution. This stock standard solution was immediately diluted with DI water to prepare FA standard solutions in concentration range from 0.0500 µg/mL to 2.00 µg/mL. All other reagents used in this work are analytical reagent grade.
A 10 mg/mL Chitosan solution was prepared by mixing 0.50 grams Chitosan with 50 mL of 2% acetic acid solution. The Chitosan powder was dissolved in the acetic acid solution by magnetic stirring at room temperature for 12 hours. A Chitosan MIP coating solution was prepared by mixing 1.0 mL of the 10 mg/mL Chitosan solution, 25 µL of the 50% GA solution and 100 µL of the 100 µg/mL FA solution in a small testing tube. The mixed solution was vigorously shaken for 2 minutes before coating the solution on surface of a BOFP.
2.2. Instrument
An optical fiber compatible UV/Vis spectrometer (USB4000, OceanOptics, Inc., Dunedin, FL, USA) and an optical fiber compatible deuterium/tungsten combo light source (DH- 2000, OceanOptics, Inc.) were used for recording optical spectrometric response of the MIP-EW-OFCS. The USB4000 optical fiber spectrometer was connected to a computer with a dedicated USB connector. A computer program (OceanView, OceanOptics, Inc) provided by the instrument maker was used to record the optical spectroscopic spectrum.
2.3. MIP Coated Optical Fiber Probe
In this work, a deep UV transmission enhanced optical fiber (FG200AEA, fiber core/cladding diameter = 200/220 µm, Thorlabs, Newtown, NJ, USA) was used to make the BOFP, because the MIP-EW-OFCS will detect the optical absorbance below 350 nm as a sensing signal. An “U” shaped BOFP was prepared by following a procedure reported in our previous publications [18-24]. In brief, the center of a short piece (30 cm) of the optical fiber was inserted into a micro butane torch flame. About 1 cm length of the central part of the fiber’s protection jacket and cladding was burned off. The bare fiber core was further forced to bend in the flame to form a “U” shaped structure. The “U” shaped part of the optical fiber core was soaked in a K2Cr2O7/H2SO4 washing solution for 5 minutes to wash off any organic species on bent fiber core surface, then rinsed with DI water. The fiber core probe was then soaked in a 1 M NaOH solution for 10 min and then rinsed with DI water again.
In coating a Chitosan MIP membrane on the cleaned “U”-shaped BOFP, the “U”-shaped part was inserted into the MIP coating solution and slowly pulled out. The coated fiber probe was exposed to ambient air overnight for gelation before testing.
2.4. Optical Fiber Spectroscopic Study of Washing FA Template Molecules out of Chitosan MIP Membrane
Optical fiber EW absorption spectrometry was used to monitoring washing FA template molecules out of the Chitosan MIP membrane coated on BOFP. After the gelation process, the two ends of a Chitosan MIP coated BOFP were connected with the optical fiber compatible UV/Vis spectrometer (USB4000) and the deuterium/tungsten-halogen combined light source (DH-2000) with subminiature version A connectors, respectively. The “U”-shaped probe was inserted into DI water in a small bottle, and light intensity guided through the BOFP was immediately recorded as a reference intensity for recording fiber optic EW absorption spectrum. The Chitosan MIP coated BOFP was then inserted into a 0.1 M NaOH solution for 20 min and the optical fiber EW absorption spectrum was recorded.
2.5. Testing the MIP-coated Optical Fiber Probe for Sensing FA in Aqueous Sample Solutions
After washing FA template molecules out of the Chitosan MIP membrane, the BOFP probe was then inserted back into DI water in a small bottle. The light intensity guided through the BOFP was recorded as reference light intensity after the optical intensity signal stabilized while the probe was still in DI water. The sensing probe was then inserted to a sample solution for 10 minutes and the optical absorption spectrum was recorded as a sensing signal. The sensing probe was re-inserted into the 0.1 M NaOH solution, then DI water to re-generate the sensor for next test.
3. Results and Discussion
3.1. Fiber Optic EW Spectrometric Monitoring of Washing FA Template Out from MIP Membrane Coated on BOFP
Fiber optic EW absorption spectrometry was used to monitoring FA template washing off from MIP membrane coated on BOFP surface as described in section 2.4 of this paper. A negative absorption spectrum with peak absorption wavelengths at 365 nm and 310 nm was recorded as showing in Figure 2. FA in aqueous solutions was reported absorbs UV light with peak absorption wavelengths at around 300 nm and 375 nm depends on solution pH value [27,29]. In reported FA absorption spectrum, the absorbance at 300 nm has higher absorption coefficient when compared with absorbance at 375 nm. However, FA exists in a Chitosan MIP membrane in this experiment. It was expected that the interaction of FA with Chitosan’s functional groups (amine, hydroxide) can change FA’s absorption spectrum, including shifting peak absorption wavelength and altering absorption coefficient. The negative absorption spectrum indicates that the FA molecules were washed out of the MIP membrane. The negative absorption spectrum reached a maximum absorbance value of -1.1 at 365 nm and -0.82 at 310 nm after 20 minutes keeping the BOFP probe in 0.1 M NaOH solution, and stabilized. This stabilized spectrum indicates that all the FA molecules were washed out of the membrane. The sensing probe was then transferred to DI water in a small bottle. The absorption spectrum shifted up while the probe was in DI water, but the peak absorption wavelengths and relative peak hights of the two absorption peaks did not change. It is believed that this spectrum shift was resulted from the difference of refractive index between 0.1 M NaOH solution and DI water. A new reference intensity spectrum was recorded to set the absorbance value to be zero at all wavelength. Then, the sensor can be used for recording absorption spectrum of a sample solution by deploying the probe to the sample solution.
3.2. Chitosan MIP membrane extracting FA from sample solution enhancing sensor’s sensitivity
In this sensor, the Chitosan MIP membrane coated on BOFP surface functions as a SPME membrane, which concentrates FA from a sample solution to the MIP membrane. It is expected that this SPME process will increase the sensitivity of the sensor for detecting FA in sample solutions. In experiments to investigate the sensitivity improvement effect, a bare BOFP (do not have any coating) was first exposed to a 10 µg/mL FA standard solution, and an EW absorption spectrum (Spectrum A in Figure 3) was recorded. The same BOFP was then coated with a Chitosan membrane by dipping the bent part of the BOFP into the 10 mg/mL Chitosan solution and pulling out slowly. The coated BOFP was letting for gelation overnight. This Chitosan (non-MIP) coated BOFP was tested with a 10 µg/mL FA standard solution, and an EW absorption spectrum (spectrum B in Figure 3) was recorded. After recording spectrum B, the K2Cr2O7/H2SO4 washing-NaOH activation process described in Section 2.3 of this paper was followed to washing Chitosan membrane off the BOFP and activate the bent part of the BOFP. This cleaned/activated BOFP was then coated with the Chitosan MIP coating solution to prepare a Chitosan MIP coated BOFP. The spectral response of this probe (spectrum C in Figure 3) was tested using a 2.0 µg/mL FA standard solution. The BOFP of this work was a hand-made product. It is impossible to make two BOFPs exact the same. However, the sensitivity of BOFP EW-OFCS depends on BOFP structure [30,31]. Therefore, in these experiments, a single BOFP was used to prepare sensor probes with different coatings in order to compare the sensitivity of EW-OFCS with different coating on BOFP.
The baseline-shifting corrected absorbance (Absorbance at 295 nm – Absorbance at 530 nm) values for the three spectra are: 0.0071 for spectrum A, 0.164 for spectrum B, and 0.401 for spectrum C. From these absorbance values, one can conclude that Chitosan MIP coated BOFP is 282 time more sensitive compared with the bare fiber BOFP, and 12 time more sensitive compared with the Chitosan non-MIP coated BOFP for detecting FA.
3.3. Reversibility, Response Time and Sensor’s Stability
Reversible response of a sensor is needed for repeatedly using the sensor for analyzing different samples or for continuously monitoring applications. The sensor of this work is based on a reversible SPME process, which is reversible. Therefore, this sensor is expected to be reversible. Figure 4 shows the test result of repeatedly alternative exposing the MIP membrane coated BOFP to a 1.0 µg/mL FA standard solution and DI water. This test results shows the reversibility nature of the developed sensor. The response time of the sensor is defined as the time needed for the sensor to reach 90% of the full-scale response. The response time of this sensor is calculated to be 8 minutes with the reversibility test data. It has to be mentioned that the response time and sensitivity of this membrane coating based EW-OFCS sensor depend on coating thickness. In this work, in balancing the response time and sensitivity, one dip-coating with the coating solution was used for coating the MIP membrane on BOFP surface. It is possible to make a more sensitive sensor, but that sensor will have longer response time.
Long-term stability is important for a sensor to be used repeatedly for analyzing different samples as well as for continuous monitoring applications. The stability of the Chitosan MIP membrane is critical in deciding the long-term stability of this sensor. Chitosan is a polymer with amine group in its side chains. This polymer can be dissolved in an acidic solution. This property has been used to prepare the MIP coating solution in this work. Therefore, this sensor is not recommended to be used for analyzing acidic samples. The sensor is stable when exposed to pH-neutral solutions and basic sample solutions. The stability of this sensor has been demonstrated by the fact that all data of the Chitosan MIP based sensor were collected by using one single MIP coated BOFP during three month’s research work.
3.4. Spectral Response, Calibration and Detection Limit
Figure 5 (A) shows the recorded spectra of the sensor’s response to FA standard solutions of different concentration. The recorded absorption spectra by FA extracted into Chitosan MIP membrane have peak absorptions at 300 nm and 370 nm. The peak absorbance at 300 nm is more sensitive than the peak absorbance at 370 nm, which is different from what observed in the experiment of washing out FA from MIP membrane (Figure 2). This difference is believed caused by the difference of FA concentration in MIP membrane. FA concentration in Chitosan MIP is much higher when the MIP was prepared. The high FA concentration in Chitosan MIP makes the microenvironment within the MIP membrane acidic. In this experiment of testing the sensor’s response to FA standard solutions, FA maximum concentration tested is 2.0 µg/mL. In this case the microenvironment in the Chitosan MIP is dominated by Chitosan’s amine group and is basic. In reported literatures, FA absorption spectrum and absorbances at peak absorption wavelengths are pH dependent [27,29].
In calibrating the sensor’s response for quantitative FA analysis, the difference of absorbance at 300 nm and 530 nm was used as a sensing signal because there is a baseline shift with the increase of FA concentration. Figure 5 (B) shows the relationship of baseline shift corrected sensing signal with FA concentration in standard solution. In the tested concentration range, the sensing signal has a linear relationship with FA concentration up to 2.0 µg/mL. The detection limit of the sensor is defined as FA concentration that causes a sensing signal which is three times the standard deviation of blank signal. The blank signal’s standard deviation calculated from data in sensor’s time response test is 0.0017. The calculated detection limit of this sensor is 26 ng/mL. This detection limit is much lower when compared with reported UV/Vis spectrometric method for detecting FA [9,10,12].
3.5. Investigating Sensor’s Response to Other Chemicals Co-Existing with Vitamin B9 in Vitamin B Supplemental Products
Vitamin B supplemental products are available from market as a vitamin B source for those who does not take enough vitamin B from food source. In this work, the developed sensor was used to analyzing a vitamin B (Vitamin B50 complex) product. Such a vitamin B complex tablet contains all the needed vitamin Bs as well as some inactive ingredients, such as cellulose, hypromellose, croscarmellose, sodium salt, silicon dioxide, magnesium stearate and polyethylene glycol. In this experiment, the response of the developed sensor to some of the ingredients in vitamin B complex was investigated. The compounds tested include KCl as an example of inorganic salt, sugar as an example of carbohydrates, urea, caffeine as examples of organic base, citric acid as an example of organic acid. In addition, the response of this sensor to riboflavin (vitamin B2), nicotinic acid (vitamin B3), thiamine (vitamin B1) was also investigated. Figure 6 shows the recorded spectral response of this sensor to the tested compounds. The spectral response of this sensor to a 1.0 µg/mL FA standard solution is also included in this graph for comparison. These test results indicate that the existence of the tested compounds in a sample solution does not cause interference in using this sensor to detect vitamin B9 in a sample solution. Although nicotinic acid (40 µg/mL) and citric acid (100 µg/mL) cause small spectral response, the sensitivity of this sensor to these compounds are hundreds of times lower when compared with the sensor’s response to vitamin B9.
3.6. Analyzing Vitamin B9 In a Vitamin B Supplemental Product
In this work, the developed MIP-EW-OFCS was applied to analyze vitamin B9 in a vitamin B supplemental product (Vitamin B50 complex) purchased from a local pharmacy store. In preparing the sample solution, a Vitamin B50 complex tablet was added to 400 mL DI water in a glass bottle. The vitamin tablet was letting to dissolve in DI water with occasionally shaking the bottle. After 24 hours, a strong yellow colored solution was obtained, but with some undissolved substances settling on the bottle’s bottom. Three testing sample solutions were prepared. Three 4 mL aliquot sample solutions were taken from the upper layer clear solution and were analyzed for each prepared test sample solution. In analyzing vitamin B9 in the 4 mL sample solution, the BOFP sensor probe was just insered into the sample solution and recorded the EW absorption spectrum after 10 minutes.
Table 1 lists the analytical results. A Vitamin B50 complex tablet has a claimed 400 µg of vitamin B9, which means vitamin B9 concentration in the prepared test sample solution is 1.00 µg/mL. The obtained analytical results showing in Table 1 agree well with this claimed quantity. In another effort to further verify the effectiveness of the developed sensor for analyzing vitamin B9 in the vitamin complex tablet, a standard addition/recovery test was performed. A standard addition sample was prepared by taking 2.00 mL of a vitamin B50 complex testing sample solution, adding 1.00 mL of 2.00 µg/mL FA standard solution and 1.00 mL of DI water. Three standard addition samples were prepared and analyzed for each vitamin B50 complex test sample solution. The obtained analytical results are also listed in Table 1. The recovery rate was found to be ranged from 100% to 104%.
Conclusions
An MIP-EW-OFCS has been developed for selective detecting vitamin B9 in vitamin B supplemental products. This sensor uses MIP as a SPME media to selectively extract/concentrate vitamin B9 into a MIP membrane which is coated on the surface of a BOFP. The vitamin B9 molecules concentrated into the MIP membrane is detected by using fiber optic EW absorption spectrometry. The SPME significantly improve the sensor’s sensitivity and selectivity. The sensor achieved a detection limit of 26 ng/mL, which is much lower than that achieved with traditional UV absorption spectrometric methods [9,19,12]. The developed sensor is a green analytical technique, do not use any chemical reagent in the sample analysis process, because the SPME is a reversible process, and the intrinsic optical absorption signal of vitamin B9 itself was used as a sensing signal. The developed sensor was used for analyzing vitamin B9 in a vitamin supplemental product, and analytical results demonstrated the feasibility of using this sensor technique for analyzing vitamin B9 in vitamin supplemental products.
- Bjorke-Monsen L, Ueland PM (2023) Folate – a scoping review for Nordic nutrition recommendations. Food Nutrition Research, 67: 10258.
- Bo Y, Zhu Y, Tao Y, Li X, Zhai D, Bu Y, Wan Z, Wang L, Wang Y, Yu Z (2020) Association between folate and health outcomes: An umbrella review of meta-analyses. Frontier in Public Health, 8: 550753.
- Crider KS, Qi YP, Yeung LF, Mai CT, Zauche LH, Wang A, Daniels K, Williams JL (2022) Folic acid and the prevention of birth defects: 30 years of opportunity and controversies. Annual Review of Nutrition, 42: 423-52.
- Witthoft CM, Forsskn K, Johannesson L, Jagerstad M (1999) Folates - food sources, analyses, retention and bioavailability. Scandinavian Journal of Nutrition, 43:138-146.
- Pavithra R, Kanimozhi NV Sukumar M (2025) Vegetables as a good source of folic acid and its beneficial role as a dietary supplement: A review. International Journal of Vegetable Science, 31: 111-34.
- Singh J (2022) Vitamin B9 in dark green vegetables: “Deficiency disoerders, bio- availability, and fortification issues” in “B-complex vitamins-sources, intakes and novel applications”, ed. LeBlanc JG, IntechOpen.
- Al-Mashhadane FA, Al-Mashhadane AA, Taqa AAR (2018) Folic acid supplementation: A review of the known advantages and risks. Public Health and Preventive Medicine, 4: 51-9.
- Crider KS, Bailey LB, Berry RJ (2011) Folic acid food fortification-its history, effect, concerns, and future directions. Nutrients, 3: 370-84.
- Modupe O, Maurras JB, Diosady LL (2020) A spectrophotometric method for determining the amount of folic acid in fortified salt. Journal of Agriculture and Food Research, 2: 100060.
- Aberásturi F, Jiménez AI, Jiménez F, Arias JJ (2001) UV-visible first-derivative spectrophotometry applied to an analysis of a vitamin mixture. Journal of Chemical Education, 78: 793-5.
- Wei S, Zhao F, Xu Z, Zeng B (2006) Voltammetric determination of folic acid with a multi- walled carbon nanotube-modified gold electrode. Microchimica Acta, 152: 285-90.
- Nithya A, Dalbhagat CG, Mishra HN (2023) Development of a simple method for extraction and analysis of folic acid in fortified rice kernels by HPLC and its application in vitamin retention studies. Journal of Food Measurement and Characterization, 17: 6440-51.
- Deconinck E, Crevits S, Baten P, Courselle P, De Beer J (2011) A validated ultra high pressure liquid chromatographic method for qualification and quantification of folic acid in pharmaceutical preparations. Journal of Pharmaceutical Biomedical Analysis, 54: 995-1000.
- Lebiedzinska A, Dabrowska M, Szefe P, Marszah M (2008) High-performance liquid chromatography method for the determination of folic acid in fortified food products. Toxicology Mechanism and Methods, 18: 463-7.
- Nelson BC, Sharpless KE, Sander LC (2006) Quantitative determination of folic acid in multivitamin/multielement tablets using liquid chromatography/tandem mass spectrometry. Journal of Chromatography A, 1135: 203-11.
- Martins-Júnior HA, Wang AY, Alabourda J, Pires MAF, Vegac OB, Lebre DT (2008) A validated method to quantify folic acid in wheat flour samples using liquid chromatography - tandem mass spectrometry. Journal of Brazil Chemical Society, 19: 971-7.
- o-Prieto RP, Haytowitz DB, Holden JM, Rogers G, Choumenkovitch SF, Jacques PF, Selhub J (2006) Use of the affinity/HPLC method for quantitative estimation of folic acid in enriched cereal-grain products. Journal of Nutrition, 136: 3079-83.
- Xu L, Fanguy JC, Soni K, Tao S (2004) Optical fiber humidity sensor based on evanescent wave scattering. Optics Letters, 29: 1191-3.
- Tao S, Fanguy JC, Xu L (2006) Optical fiber ammonia sensing probes using reagent immobilized porous silica coating as transducers. Sensors & Actuators, B: Chemistry, 115: 158-63.
- Guo H, Tao S (2007) Silver nanoparticles doped silicate nanocomposites coated on an optical fiber for ammonia sensing. Sensors & Actuators, B: Chemistry, 123: 578-82.
- Hu X, Tao S (2011) An optical fiber H2O2-sensing probe using a titanium(VI) oxyacetylacetonate immobilized Nafion coating on an bent optical fiber probe. IEEE Sensors Journal, 11: 2032-6.
- McDonald SR, Tao S (2024) An optical fiber chlorogenic acid sensor using a Chitosan membrane coated bent optical fiber probe as a transducer. Analytica Chimica Acta, 1288: 342142.
- McCaslin JD, Miller JW, Tao S (2025) An optical fiber acetylsalicylic acid sensor using a cellulose triacetate cladding on fiber core surface for solid phase extraction. Journal of Analysis Testing, in Press.
- McCaslin JD, Tao S (2025) An optical fiber aspirin sensor with molecularly-imprinted polymer coating on fiber core surface as transducer. Microchemical Journal, 212: 113422.
- Meléndez-Marmolejo J, de Leon-Martinez LD, Galvan-Romero V, Villarreal-Lucio S, Ocampo-Perez R, Medellin-Castillo NA, Padilla-Ortega E, Rodriguez-Torres I, Flores- Ramirez R (2022) Design and application of molecularly imprinted polymers for adsorption and environmental assessment of anti-inflammatory drugs in wastewater samples. Environmental Science and Pollution Research, 29: 45885-902.
- Gao W, Li GL, Liu H, Tian Y, Li WT, Fa Y, Cai YQ, Zhao ZS, Yu YL, Qu GB, Jiang GB (2021) Covalent organic frameworks with tunable pore sizes enhanced solid-phase microextraction direct ionization mass spectrometry for ultrasensitive and rapid analysis of tetrabromobisphenol A derivatives. Science of the Total Environment, 764: 144388.
- Wu Z, Li X, Hou C, QianY (2010) Solubility of folic acid in water at pH values between 0 and 7 at temperatures (298.15, 303.15, and 313.15) K. Journal of Chemical Engineering Data, 55: 3958-61.
- Al-Shammary FJ, Al-Rashood KA, Mian NAA, Mian MS (1990) “Analytical profile of folic acid" In “Analytical Profiles of Drug Substance”, eds. Florey K, Al-Badr AA, Wozniak TJ, vol. 19, pp. 221-59, Academic Press, New York.
- Poe M (1977) Acidic dissociation constants of folk acid, dihydrofolic acid, and methotrexate. Journal of Biological Chemistry, 252: 3124-8.
- Gupta BD, Sharma NK (2002) Fabrication and characterization of U-shaped fiber-optic pH probes. Sensors & Actuators, B: Chemistry, 82: 89-93.
- Gupta BD (2001) A novel probe for a fiber optic humidity sensor. Sensors & Actuators, B: Chemistry, 80: 132-35.
FIGURE 1
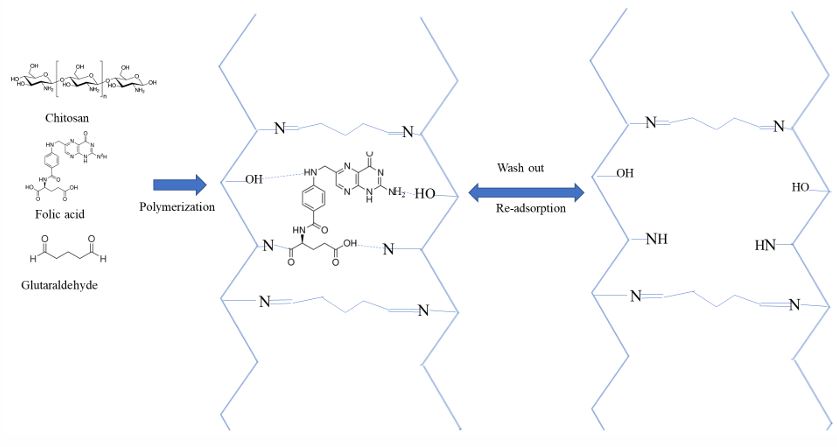
Figure 1: A diagrammatic drawing show the process of a FA templated Chitosan MIP synthesizing, washing out FA template and selective re-adsorption of FA into the template
FIGURE 2
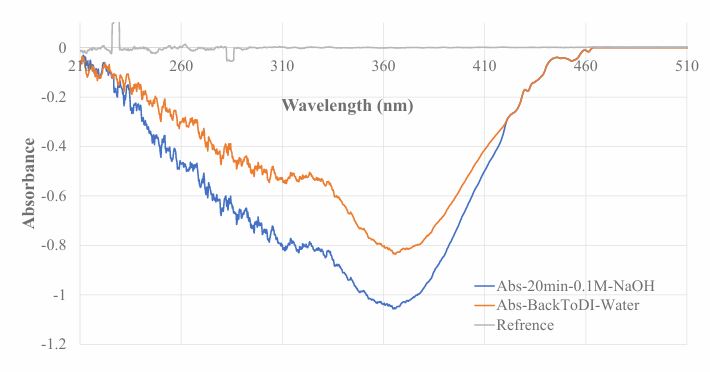
Figure 2: Optical fiber EW absorption spectrum recorded during washing FA template molecules out of the MIP membrane coated on a BOFP. The reference light intensity was recorded when the newly made MIP was just inserted to DI water. During the washing off process, FA molecules washed out, and a negative absorption spectrum was resulted.
FIGURE 3
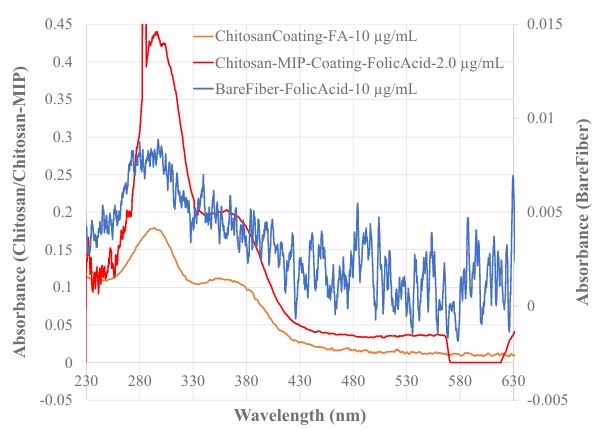
Figure 3: Optical fiber EW absorption spectra recorded with a bare BOFP exposed to a 10.0 µg/mL FA standard solution (spectrum A), a Chitosan non-MIP coated BOFP exposed to a 10.0 µg/mL FA standard solution (spectrum B), and a Chitosan MIP coated BOFP exposed to a 2.00 µg/mL FA standard solution (spectrum C). one single BOFP was used to reording the spectra.
FIGURE 4
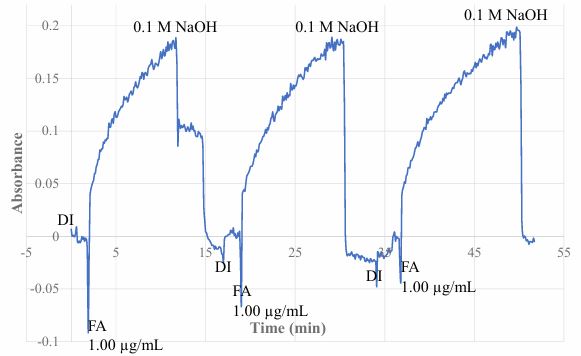
Figure 4: Time response of a MIP-EW-OFCS alternatively exposed to DI water and a 1.00 µg/mL FA standard solution, repeatedly. This test result demonstrates the sensor’s reversibility and response time. The signal goes down at around 12 min was the result of mistake in operation.
FIGURE 5
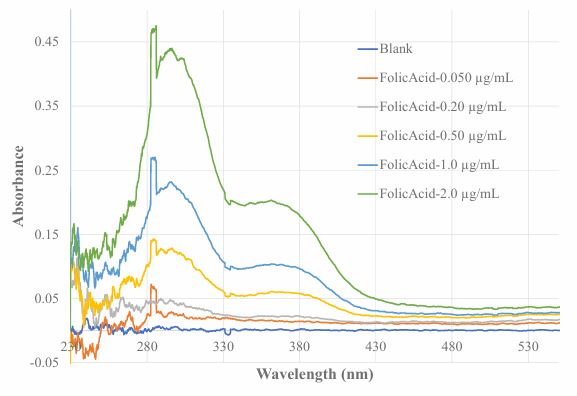
FIGURE 6
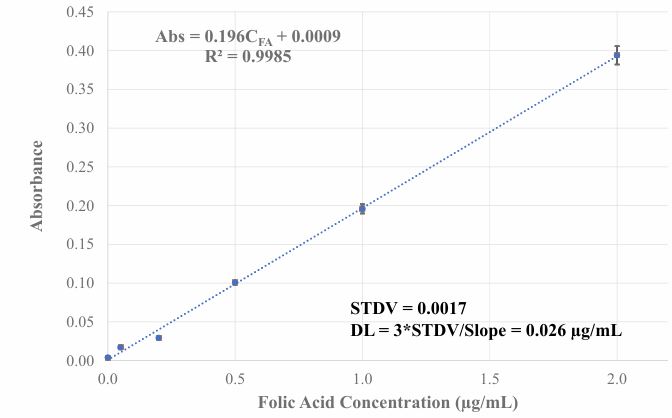
Figure 5: Spectral response of MIP-EW-OFCS of this work to FA standard solution of different concentration (Figure 5 (A)). The spike at around 284 nm was caused by a light intensity spike from DH-2000 light source. It is not FA’s absorption spectrum. The relationship of baseline-shift corrected absorbance value with FA concentration is showing in Figure 5 (B).
FIGURE 7
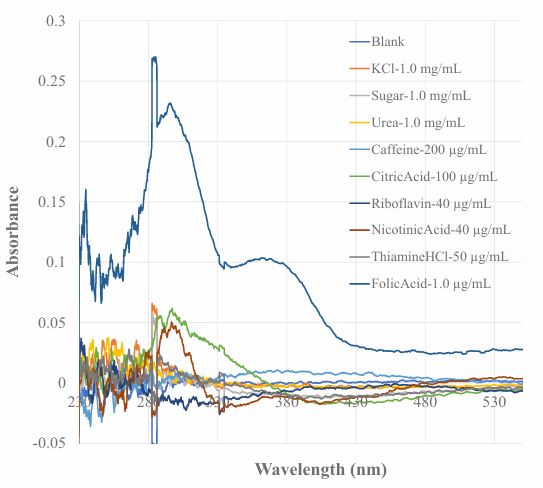
Figure 6: Spectral responses of the MIP-EW-OFCS exposed to standard solutions of different substances. The concentration of the substances tested is also given in this graph.
Tables at a glance
Figures at a glance