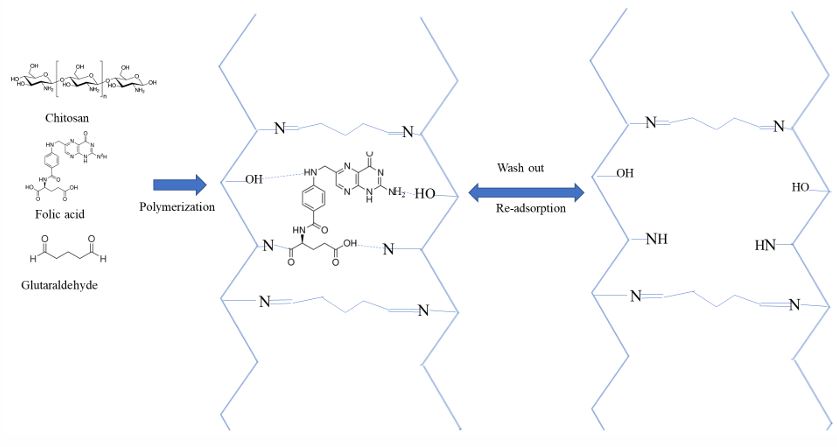
Figure 1: A diagrammatic drawing show the process of a FA templated Chitosan MIP synthesizing, washing out FA template and selective re-adsorption of FA into the template
Figure 1: A diagrammatic drawing show the process of a FA templated Chitosan MIP synthesizing, washing out FA template and selective re-adsorption of FA into the template
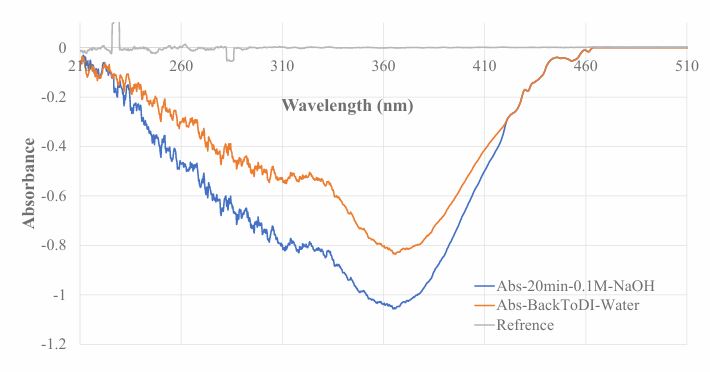
Figure 2: Optical fiber EW absorption spectrum recorded during washing FA template molecules out of the MIP membrane coated on a BOFP. The reference light intensity was recorded when the newly made MIP was just inserted to DI water. During the washing off process, FA molecules washed out, and a negative absorption spectrum was resulted.
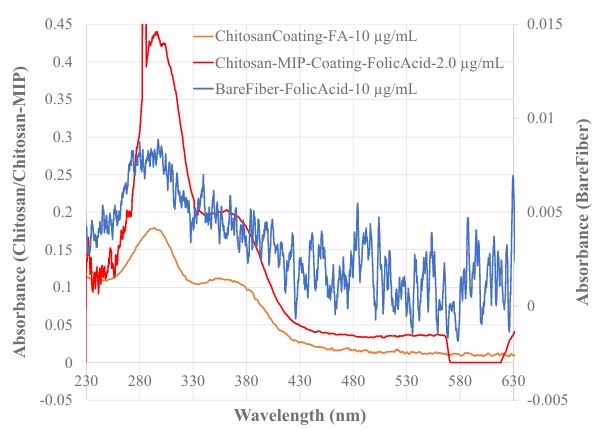
Figure 3: Optical fiber EW absorption spectra recorded with a bare BOFP exposed to a 10.0 µg/mL FA standard solution (spectrum A), a Chitosan non-MIP coated BOFP exposed to a 10.0 µg/mL FA standard solution (spectrum B), and a Chitosan MIP coated BOFP exposed to a 2.00 µg/mL FA standard solution (spectrum C). one single BOFP was used to reording the spectra.
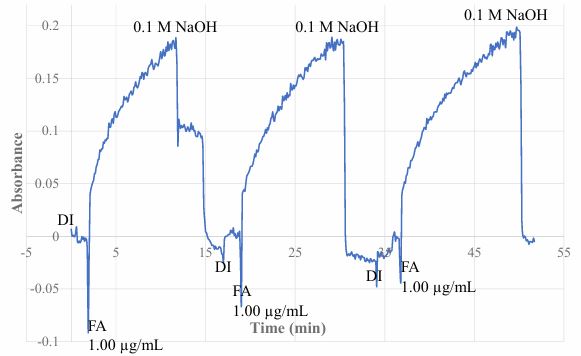
Figure 4: Time response of a MIP-EW-OFCS alternatively exposed to DI water and a 1.00 µg/mL FA standard solution, repeatedly. This test result demonstrates the sensor’s reversibility and response time. The signal goes down at around 12 min was the result of mistake in operation.
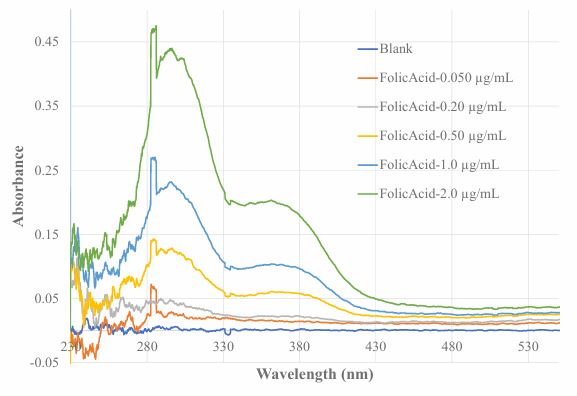
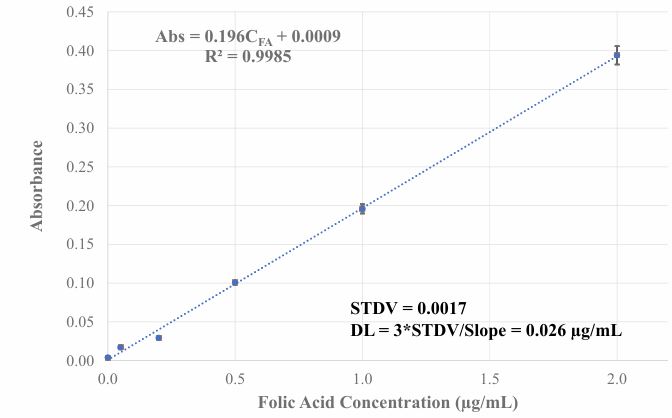
Figure 5: Spectral response of MIP-EW-OFCS of this work to FA standard solution of different concentration (Figure 5 (A)). The spike at around 284 nm was caused by a light intensity spike from DH-2000 light source. It is not FA’s absorption spectrum. The relationship of baseline-shift corrected absorbance value with FA concentration is showing in Figure 5 (B).
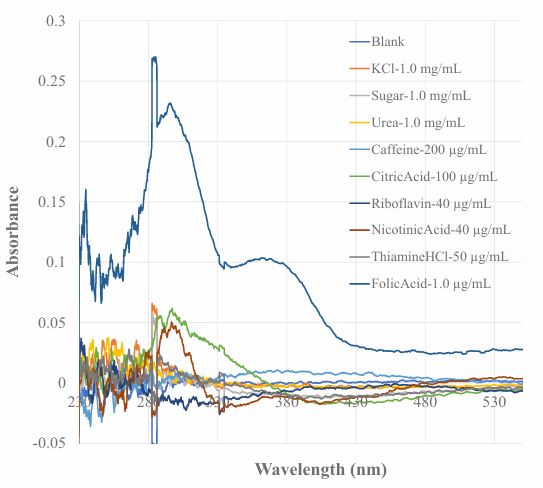
Figure 6: Spectral responses of the MIP-EW-OFCS exposed to standard solutions of different substances. The concentration of the substances tested is also given in this graph.
Tables at a glance
Figures at a glance