Comparison of Bioaccumulated Polycyclic Aromatic Hydrocarbons in Low and High Fat Cow Milk: Development of Simple and Sensitive Microextraction Method for the Simultaneous Analysis
Received Date: June 17, 2026 Accepted Date: June 27, 2026 Published Date: June 29, 2026
doi:10.17303/jfn.2026.12.104
Citation: Fatemeh Barzegar, Marzieh Kamankesh, Abdorreza Mohammadi (2026) Comparison of Bioaccumulated Polycyclic Aromatic Hydrocarbons in Low and High Fat Cow Milk: Development of Simple and Sensitive Microextraction Method for the Simultaneous Analysis. J Food Nutr 12: 1-17
Abstract
The bio-accumulation of polycyclic aromatic hydrocarbons (PAHs) in cow milk has been known as one of the critical hazardous food contaminants. In the present study, the simultaneous determination of sixteen PAHs in milk samples was accomplished applying efficient microextraction method followed by gas chromatography-mass spectrometry (GC-MS). The major factors effected on the microextraction process such as type of extraction solvents (carbon tetrachloride, chloroform and ethylene tetrachloride), type of dispersive solvents (acetone, acetonitrile, methanol and ethanol), extraction solvent volume (40-120 μL), dispersive solvent volume (300-800 μL), pH level (3-11) and salt amount (0-20%) were optimized. Ethylene tetrachloride and acetone were selected as efficient extraction and dispersive solvents. The optimization process revealed that the highest efficiency of PAHs extraction in milk is achieved with 80µL of ethylene tetrachloride, 300 µL of acetone, 10% of salt and pH 7. According to the results, all PAH16 were detected in milks samples. The proposed analytical method could facilitate precise monitoring of PAHs and help related organizations for curb these food contaminants in more food products.
Keywords: Polycyclic aromatic hydrocarbons (PAHs), cow milk, microextraction, gas chromatography-mass spectrometry (GC-MS)
Introduction
Milk is health-promoting liquid food in human diet and be widely consumed by different age groups due to its high nutritional value. Milk is considered as a main source of calcium, vitamin D, potassium and also supplies essential nutrients such as protein, saturated fatty acids, phosphorus, vitamin B12 and riboflavin [1]. The current information highlight the importance of milk in food pyramid [1,2]. While the entrance of food contaminants could be threatening the safety of milk and have adverse effect on human health. Evidence-based information demonstrates that polycyclic aromatic hydrocarbons (PAHs) are serious food contaminants, which unwillingly enter in to milk [3,4].
PAHs have been listed as organic contaminants containing fused aromatic rings comprised of carbon and hydrogen. These chemicals are chemically colorless or pale-yellow solids and derived from both natural routes (volcanoes, fires) and anthropogenic activities (imperfect combustion or pyrolysis of organic compounds, fossil fuels, smoking) [5]. PAHs have been detected in soil, air, water and foodstuffs. These compounds are formed in food products by heating processes such as frying, grilling or roasting [4,6,7]. It is also emphasized that plants absorb PAHs from polluted air, water and soil in industrialized region. Thus, the ingestion of contaminated grass or plants by livestock lead to the uncontrolled entrance of PAHs to food with animal origins. These chemical substances with lipophilic character aggregate in milk due to high fat content [3,7,8]. It was also reported that when the cow exposes to PAHs by aspiration, ingestion or even absorption via the skin, these contaminants are metabolized by cytochrome-450 enzymes to diol-epoxyde derivatives. The binding of these compounds to glucuronic acid or sulphates simplifies their entrance to milk [9]. Several PAHs are reported as carcinogens, mutagens, teratogens and genotoxic in the light of different studies [5]. The International Agency for Research on Cancer (IARC) has categorized benzo(a)pyrene as class 1A (carcinogenic to humans), dibenzo(a,h) anthracene as class 2A (probably carcinogenic to humans) and benzo(b)fluoranthene, benzo(k)fluoranthene, benzo(a)anthracene, indeno(1,2,3-cd) perylene and chrysene as group 2B (possibly carcinogenic to human). Those types of PAHs are not carcinogenic but have synergistic effect [10]. The European Food Safety Authority (EFSA) has determined that the concentrations of benzo[a]pyrene (BaP) and the sum of the concentrations of four PAHs such as benzo[a]pyrene (BaP), benz[a]anthracene (BaA), benzo[b]fluoranthene (BbF) and chrysene (Chry) (PAH4) are the main indicators of PAH toxicity in foods [11]. The long-term exposure to PAHs may have detrimental effects on human body such as skin inflammation, respiratory problems, immune system malfunction, asthma-like symptoms, kidney and liver damage [3]. Previous researches indicated that the milk samples consumed by Taiwan population contained PAHs in the range of 4000-310,000 ng L-1 [12]. In 2020, Shariatifar and coworkers also announced that the Iranian milk and milk powder contained 20-40 ng kg-1 PAHs [8]. The consumption of milk containing PAHs may have abovementioned side effects and bring about chronic disease. Therefore, the extraction and determination of PAHs in food products specially in milk samples with high consumption rate and market among people seems obligatory.
Because of dangerous effects of PAHs on health, the measurement of these compounds in PAH-containing food is crucial issue. It should be highlighted that the analytical technique employed to provide main insights into PAHs concentration must be robust, accurate, sensitive and selective. According to literature different analytical instruments like high performance liquid chromatography (HPLC) [13,14], gas chromatography-mass spectrometry (GC-MS) [15], thin-layer chromatography (TLC) [16] and capillary zone electrophoresis (CZE) [17] were established for the designation of PAHs in various human meal. With respect to the intricacy of food matrices and high matrix interferences, sample pretreatment involving, extraction, sample clean-up and enrichment is mandatory. Different sample pretreatment methods such as soxhlet extraction, liquid-liquid extraction (LLE) [18,19], solid phase extraction (SPE) [20], stir bar sorptive extraction (SBSE) [16] ultrasound-assisted solvent extraction (USAE) [21], accelerated solvent extraction (ASE) [22] and QuEChERS [23] have been used to analyze PAHs. These conventional procedures have many drawbacks including low recovery, high cost, long extraction time, high consumption volume of toxic solvents, and poor adaptability with analytical instruments. Thus, dispersive liquid-liquid microextraction (DLLME) as a powerful procedure was established for the compensation of abovementioned shortcomings and improve the extraction performance with novel green chemistry.
Rezaee and his co-workers introduced DLLME in 2006 as a novel microextraction technique [24]. In this procedure, trace amount of extracting and disperser solvents were instantly entered into the sample solution. Using the dispersive solvent cause to disperse the extraction solvent throughout the aqueous phase, completely, and target analytes extract easily to extraction phase. The main advantages of this technique are quickness, safety, high recovery, good enrichment factor, repeatability and good automation with different analytical instruments.
The objective of the current investigation is detection and quantification of 16 types of PAHs in cow milk samples. DLLME joined with GC-MS has been applied as extraction and separation method. The main factors, which dramatically effect on microextraction process like kind and level of extracting and dispersive solvents, salt amount and pH were optimized. The suggested technique was employed for the analysis of milk samples, and admissible consequences were achieved.
Materials and Methods
Reagents
The mixed standard of PAH16(QTM, 2000 μg mL-1) was obtained from Supelco (Bellefonte, PA, USA). Biphenyl and hydroxide potassium (>85%), ethanol (99.6%), dichloromethane, hydrochloric acid, acetone, methanol, sodium chloride, acetonitrile, carbon tetrachloride, tetrachloroethylene and chloroform were provided from Merck (Darmstadt, Germany). Zinc acetate and potassium hexaferrocyanide were purchased from Panreac (Belzhike). For the preparation of carrez I (0.25 mol L-1), 10.6 gram of potassium hexaferrocyanide was dissolved in 100 mL distilled water. Carrez II (0.4 mol L-1) was also provided by mixing 21.9 gram of zinc acetate with 3 mL of acetic acid. Afterward, distilled water was added to adjust the final volume to 100 mL. The whole chemicals used in the current research were used at highly pure.
Preparation of standard solutions
The mixed stock standard solution of 16 PAHs (2000 μg mL-1) was provided in dichloromethane. This obtained solution was diluted with methanol to achieve a working solution. This solution was employed to assess extraction efficiency under various circumstances (1-500 ng mL-1). The internal standard (Bipheny) also provided in methanol (40 ng mL-1). The obtained solutions were kept at 4C in refrigeration. The specified amount of hydrochloric acid was used to regulate the pH of the solutions.
Instrumentation
The chromatographic isolation and detection of PAHs were executed with a 7890A GC from Agilent Technologies (Palo Alto, CA, USA) with a triple-axis detector joined with a split/spitless injector and equipped with a 5975C inert MSD network mass selective detector. By drawing on HP-5 MS capillary column (30m×0.25 mm ID, 0.25 μm film thickness) 16 types of PAHs were separated. The GC oven temperature was started at 150C for 2 min, and was increased by 7C min-1 to 200C, maintained for 1 min, raised by 5C min-1 to 250C and then kept for 1 min. Eventually, the temperature was raised quickly by 20C min-1 to 290C and held for 10 min. Helium was selected as a carrier gas in a steady flow of 0.8 mL min-1. The auxiliary and injector temperature were adjusted at 280C and 290C, respectively. 2 μL of the sample was injected in a split mode. The target analytes were measured in the selected ion monitoring (SIM) mode, and one qualifier ion was chosen for per components.
Sampling
Ten numbers of cow milk including high and low fat were randomly collected from different supermarkets (Tehran, Iran). Five numbers of milk were selected low fat (1.5%) and 5 numbers were high fat (3%). The 5 brands of milk samples were chosen from highest consumption among peoples.
Sample preparation
One mL of spiked milk (100 ng mL-1) was accounted for and 10 mL of a mixture of KOH (2 mol L-1) and ethanol with ratio of 80:20 was mixed with milk sample; we tested different ranges between 0 and 50 (0, 10, 20, 30, 40, 50) percent of ethanol that the best response was obtained for 20% containing 1.5 times higher than the other levels. The sample was completely shaken and then centrifuged at 2683.2 g during 5 min. Then, the clear upper liquid was isolated and transferred to another test tube. The sample solution pH was adjusted to 7. Then, 1 mL each carrez I and 1 mL carrez II solutions were poured out to obtained clear sample solution. After shakingfor 1 min, the sample solution was centrifuged once more again at 2683.2 g during 5 min and after that, the supernatant was completely isolated. Afterwards, the obtained solution was ready for microextraction method.
Microextraction process
10%Ten percent of NaCl was added to sample solution. Then, the obtained solution was properly mixed and 80 μL of ethylene tetrachloride as extracting solvent, 300 μL of acetone as dispersive solvent and 2 μL of biphenyl (40 ng mL-1) were immediately injected into the sample solution. The values used in this process were obtained from the experiment described in section 3. The obtained mixture was gently mixed for 1 min to reach a cloudy solution. The cloudy mixture was centrifuged at 2683.2 g within 5 min to separate the extraction phase. The extraction phase was gathered at the bottom of conical flask and 2 μL was directly injected to the GC-MS.
Experimental design
In this study, one variable at a time (OVAT) was employed based on previous study employed to analyze PAHs and some researchers have shown that OVAT can be applied for the optimization process. The extraction process was performed according to the method of Rezaeei et al. (2006) with some modifications [24]. In this paper, DLLME was employed as efficient method to analyze PAHs in cow milk samples and the volume of extraction and disperser solvents were improved. In reference 29, eight microliter extraction solvent and one mL disperser solvent were used. In this study, we tried to reduce the volume of extraction solvent to prevent the dilution effect and increase the volume of extraction solvent, because eight microliter is low volume to collect after centrifugation. Also, pH and salt effects were optimized and modified that these factors have not been considered in reference. Kind of extraction solvent including carbon tetrachloride, chloroform and ethylene tetrachloride and dispersive solvent including acetone, acetonitrile, methanol and ethanol and amount of them (40-120 µL for extraction solvent and 300-800 µL), pH (3-11) and NaCl (0-20%) were selected as the main factors. The mean peak area of 16 PAHs was considered as the GC-MS respond, to assess the recovery yield and extraction efficiency.
When all abovementioned variables were optimized, dynamic linear range (DLR), relative standard deviation percent (RSD%), limits of quantification (LOQs), limits of detections (LODs), Recovery and enrichment factor (EF) were computed for the evaluation of analytical method. These figures of merits are well-known and referenced methods for assessing the validation step [25]. Standard addition test was used to validate the method and the results was compared with other researches.
Results and Discussion
In an attempt to achieving the highest extraction output, the momentous factors such as kind and amount of the extracting and disperser solvents, pH and NaCl percentage were chosen and optimized. These variables have been selected based on the DLLME mechanism and performance in the extraction of target PAHs.
The optimization of extraction solvent type and the optimization of disperser solvent type
The type of appropriate extracting and dispersive solvents is the main factors must be specified in the DLLME process (Figure 1). The proper extracting solvent is selected with regard to higher density than water, lower solvability in water, suitable chromatographic behavior and strong capability for the proper extraction of target analytes. Carbon tetrachloride (density: 1.58 g/cm3, water solvability: 0.81 g/L), chloroform (density: 1.48 g/cm3, water solvability: 8.09 g/L) and ethylene tetrachloride (density: 1.62 g/cm3, water solvability: 0.15 g/L) were investigated for this objective. Ethylene tetrachloride showed higher recovery for the extraction of PAHs because of higher density and lower water solvability of this solvent compared to other solvents. Tetrachlorethylene was also used by other researches as the proper extraction solvent that showed the acceptable result and sufficient extraction recovery for the extraction of PAHs from water and food samples [26]. For instance, in 2021, Ghiasi et al. used tetrachlorethylene for the microextraction of acrylamide from infant formula [27]. In other studies, different organic solvents were used in the DLLME procedure. In one of the investigations, an ultrasound-assisted DLLME was developed for the extraction of various PAHs in water samples. Chloroform, dichloromethane, dichloroethane, and carbon tetrachloride were investigated as extraction solvents. Tetrachloroethylene was not evaluated in this study. The systems using dichloroethane or carbon tetrachloride as the extracting solvent showed the lowest recoveries. In addition, the extraction phase was not separated in the case of dichloromethane. Acceptable PAH recoveries were obtained using chloroform [28]. In 2021, Omidi et al. used DLLME coupled with HPLC to extract and determine Heterocyclic Aromatic Amines (HAAs) as carcinogenic food contaminants from fried fish samples. In their study, 1-octanol was utilized as the suitable extraction solvent, which is more compatible with the mobile phase of the reverse phase HPLC [29].
It should be pointed that dispersive solvent must completely distributes the extraction solvent throughout the aqueous phase and plays as a mediator between extracting and aqueous phase. In the current study, methanol, ethanol, acetonitrile and acetone were tested as dispersive solvent. It was figured out that acetone was the proper dispersive solvent among the other solvents. It was achieved that acetone was the best dispersive solvent due to it produced repeatable sediment phase volume and constant cloudy solutions. Also, one of the reasons for the better response of acetone is the symmetrical structure and greater solubility than other solvents in organic chlorinated solvent (extraction solvent). These properties caused to enhance the chance of miscibility of acetone to extraction solvent and created the better cloudy state. The type of dispersive solvent selected may be associated with the extraction solvent and target analytes in the aqueous phase, depending on the hypothesis. In 2019, Barzegar and colleagues selected methanol as the dispersive solvent in the DLLME method for extracting HAAs from barbecued meat. This choice was based on its high recovery rate compared to acetonitrile, ethanol, and acetone [30].
The optimization of extraction solvent volume and the optimization of disperser solvent volume
In a bid to evaluate the impact of the extraction solvent level and for the achievement of high recovery and a remarkable enrichment factor, various levels (40-120 µL) of ethylene tetrachloride were surveyed under the same experimental circumstance. This range was selected according to enrichment factor, dilution factor and the collection ability of the extraction solvent. The primary tests were shown that the volume lower than 40 μL could not be collected for the injection to GC-MS and using of higher volume than 120 μL caused the dilution effect and the extraction response and enrichment factor were decreased. Figure 2 corroborates that 80 μL of ethylene tetrachloride was achieved as optimal volume. While, Ghiasi et al. 2021 applied 60 μL of ethylene tetrachloride for the extraction of acrylamide in the microextraction process [27]. The volumes lower than 80 μL was not adequate for the extraction of PAHs from aqueous phase and practically after final centrifuge step did not collect completely at the bottom of vial. Therefore, the lack of analyte was happened. The extraction efficiency slightly decreased in the volumes more than 80 μL owing to dilution phenomenon. In fact, the aim of optimization was to achieve the lowest volume of extraction solvent to get the best enrichment factor. Higher volume of extraction solvent cause to distribute of analyte and the response was declined.
The efficacy of the dispersive solvent amount on the extraction yield of 16 PAHs was also investigated. Figure 2 depicts that the acetone volume was studied in the range of 300-800 μL. It should be declared that the acceptable extraction efficiency was attained by 300 μL of acetone as dispersive solvent. The lower amount of acetone could not properly distribute the extraction solvent droplets throughout the aqueous phase and rationally the PAHs could not completely extract. By the raising of acetone amount, due to the dilution phenomenon, the ultimate clear phase achieved by centrifuging enhanced and the level of PAHs in the upper phase decreased.
pH optimization and salt amount optimization (separately)
The physicochemical properties of target analyte and food matrices cause to appear a factor in optimization process. pH of the sample solution has a pivotal function in transporting the PAHs into the organic solvent. Thus, the impact of pH on the extraction of PAHs was evaluated in the limit of 3-11 (covered acidic, natural and basic ranges). Figure 3 represents that the maximum respond was received at pH 7. It was found out the transferring of PAHs into extraction solvent was more efficient in this pH due to suitable chemical structure of analytes. The optimal pH value depends on the nature of the target analytes. In one of the experiments, an optimum pH of 11 was obtained for the microextraction of HAAs. At alkaline pH levels, the concentration of H+ decreases, causing the ion type of HAAs to disappear. Conversely, HAAs become deprotonated, resulting in the creation of their neutral form. As a result, the maximum responses are observed at pH 11 [31].
Figure 3 demonstrates that 10% of NaCl achieved as optimum value for the highest extraction efficiency. Barzegar et al. 2019 obtained the same optimal value for NaCl in the DLLME process for the extraction of HAAs from chicken nuggets [32]. The accumulation of Na+ and Cl- around water molecules in aqueous phase led to release of PAHs to extracting phase, and salting-out phenomenon was occurred. The gradual decline of extraction response was observed when the salts amount increased from 10% to 20%. The salt volume higher than 20% caused the saturated state and it couldn’t be practically applied for the extraction.
The PAHs quantification in real milk samples
Table 1 depicts the merit figures of the offered procedure obtained under optimal conditions. The LOD and LOQ were defined as a chromatographic signal at the lowest concentration of the analyte that can be shown 3 and 10 times higher than background noise, respectively. The limits of detection (LODs) and limit of quantification (LOQs) for the 16 PAHs were obtained 0.22-0.41 ng mL-1 and 0.72-1.35 ng mL-1, respectively. The acceptable linearity was observed with a correlation coefficient (R2) higher than 0.99 at the concentration 1-500 ng mL-1 including 1, 5, 20, 50, 100, 200, 400, 500 ng mL-1. Peak areas obtained from six similar injections in same condition were considered as relative standard deviation (RSD%). The repeatability estimation was performed by calculation of the peak areas of six replicates and reported as relative standard deviation (RSD%). Thus, RSD% were less than 8.4 % for all 16 PAHs. The enrichment factor (EF) was defined as the ratio of the concentration of the analyte in sample solution to concentration of the analyte in extraction solvent. The enrichment factors of the offered analytical procedure were calculated 89-105. The extraction recovery was evaluated by comparing the analyte concentration before spiking milk samples and the concentration recovered after the process. To confirm the results, standard addition method has been employed for 10 milk (3 times repetition) samples at a concentration 100 ng mL-1. The recovery levels were obtained between 88% and 97%. The current findings corroborate that the DLLME-GC-MS technique shows good recovery, high enrichment factor and acceptable linearity and repeatability. Inter-laboratory comparison of the proposed method was carried out to approve and confirm the satisfactory of the results. Normalized error (En) and Z-score of offered technique were obtained 0.70 and 4.2, respectively.
Application to real samples and comprehensive comparison with previous researches
Ten samples of cow milk were collected from different supermarket (Tehran, Iran) and the offered method was applied to analyze 16 PAHs. The range of 16 PAHs concentration in low fat (1.5%) and high fat (3%) milk samples was reported in Table 2. The results showed the level of PAHs in low-fat milk was 1.3 times lower than high-fat milk (Figure 4). Also, PAHs were detected in all low and fat milk samples. Acenaphthylene, Phenanthrene and Benzo[g,h,i] perylene were simultaneously detected in all milk samples. The lowest amount of PAH was measured 0.8 ng mL-1 for Benzo[a]anthracene (sample 2, low-fat milk). The concentration of Chrysene (13.7±1.1 ng mL-1), one of the primary markers of PAH occurrence and toxicity, was highest in milk samples with high fat content [33]. The level of PAHs in high-fat milk products was found to be higher than in low-fat milks. It could be argued that PAHs, as non-polar compounds, are soluble in fats due to their lipophilic nature. Thus, PAHs indirectly entered to milk by cow feeding bioaccumulated in milks especially with high fat content. It was also explained that when the cow is exposed to PAHs by aspiration, ingestion or even absorption through the skin, these contaminants are metabolized by cytochrome 450 enzymes to diol-epoxyde derivatives. The binding of these compounds to glucuronic acid facilitates their entry into the milk [9]. It could be concluded that one of the main sources of PAHs in humans is milk from cows fed with polluting plants. Improperly processed, transported and stored milk may increase the risk of PAH contamination. The concentration of PAHs was analyzed in different types of foods. In one of the investigations, the 16 PAH levels were determined in Tahdigh of potato and bread, a desirable Iranian food, prepared with different edible oils. The highest and lowest levels of PAHs in potato Tahdig were obtained in samples prepared with sesame (408.3 ± 4.1 μg kg-1) and corn (59.2 ± 1.9 μg kg-1) oils, respectively. Moreover, the highest and lowest PAHs concentrations in Tahdig of bread were reported in the samples prepared with canola (550 ± 3.9 μg kg-1) and sunflower (17.9 ± 1.2 μg kg-1) oils, respectively. The type of oil used in the preparation of bread and potato Tahdig had a direct impact on the production of PAHs compounds [34]. It is obvious that the concentration of PAHs in low-fat and high-fat milk is lower than in Tahdig samples. This may be due to the indirect entry of PAHs into milk samples.
Sahin et al in 2020 determined PAH levels in various cooked meats and fish with classic sample preparation method joined with HPLC. Total PAH (Σ16PAH) contamination levels were 6.08, 4.42, 4.45, 4.91, and 7.26 μg kg-1 in meat doner, chicken doner, meatballs, grilled chicken, and fish, respectively. Benzo[a]pyrene (BaP) which is the most potentially carcinogenic PAH was not detected in meat doner, chicken doner and grilled chicken except in meatballs and grilled fish samples showed a level of 0.70 and 0.73 μg kg-1, respectively [35]. Whereas, Benzo(a)pyrene concentrations in the milk samples ranged from < LOD to 12.1 ng mL-1 in the current experiment. This may be due to the high sensitivity of the suggested method for the analysis of PAHs compared to the above conventional method. The highest concentration of Benzo(a)pyrene (12.1 ng mL-1) was found in high-fat milk (sample 10).
In a previous experiment, the concentration of 16 PAHs was measured in ten honey samples using ultrasonic bath extraction coupled with HPLC-UV/Vis. Bee products can be contaminated with various pollutants, such as PAHs, which are the result of environmental pollution. The results showed that six samples had no detectable PAHs, while four samples had low PAH concentrations with maximum values never exceeding 7 μgkg−1. Benzoa]pyrene was found in one sample. All samples with PAHs in the range < LOD to 2.56 μgkg-1 contained indeno[1,2,3-c,d]pyrene [36]. In this work, the presence of Indeno [1,2,3-c, d] pyrene was detected in milk samples at concentrations ranging from < LOD to 13.7 ng mL-1, which is significantly higher than in honey samples.
Malt is considered to be one of the most important ingredients in food. It serves as the basic raw material for beer and whiskey production. Malt flour can also be added to various breads and baked goods to enhance its color and enzymatic activity. Therefore, in 2021, a group of researchers evaluated 16 types of PAHs in various commercially available malts, such as amber, black, pilsner, and cara-120. The data showed that the highest levels of sum of PAH16 and PAH4 were 881.52 μg kg-1 and 737.57 μg kg-1, respectively, in black malt. In contrast, the lowest concentrations of PAH16 and PAH4 were obtained in amber malt with 178.99 μg kg-1 and 60.53 μg kg-1, respectively. The result of this finding is related to the kilning temperatures for the malts analyzed, which are 250 and 100-150C for black malt and amber malt, respectively. Obviously, besides environmental pollution, PAH levels in food vary depending on cooking temperature, type of food, smoking technique, choice of wood, duration of smoke exposure, etc [11]. In other words, PAHs can be transferred from air and soil. They can also occur during storage, transportation or cooking before consumption.
The European Union (EU), in Commission Regulation (EU) No 835/2011, announced a different amount of the maximum level of PAHs in food. In this regulation, benzo(a)pyrene and PAH4 (benzo[a]anthracene, chrysene, benzo[b]fluoranthene, benzo[a]pyrene) have been identified as a carcinogenic index. The maximum range 1-6 μg/kg has been announced for Benzo(a)pyrene and 1-35 μg/kg for PAH4 (European Union,2011) in different foods. The maximum level has not been determined for cow milk. The results in Table 2 indicated that the concentrations of Benzo(a)pyrene in 10 milk samples were determined between < LOD and 12.1 ng mL-1 and 5.6-38.5 ng mL-1 for PAH4. These results confirmed that the risk of PAHs in milk sample are not significant.
Figure 5 exhibited chromatograms getting from GC-MS for high-fat milk sample before (a) and after (b) spiking with the stock standard solutions at the concentration of 100 ng mL-1. High-fat milk including 16 PAHs (a sample other than the samples in Table 2) was selected to present the simultaneous extraction and clear chromatogram of 16 PAHs. This non-spiked sample is different from non-spiked sample used for the preparation and optimization sections (containing lowest level of PAHs to capable use as control sample, approximately). It is obvious that the sample matrices have no significant impact on the extraction performance and the clean chromatogram was achieved without the matrix interferences.
In 2015, 8 PAHs in different types of milk (dairy products) were determined using solid phase extraction and GC-MS. Recovery was reported between 86.87% and 103.57%. LOD and LOQ were reported in the range 0.04-0.20 µg kg-1, 0.12-0.60 µg kg-1, respectively. The mean concentration of benzo[a]pyrene (BaP) was 0.34 µg kg-1 from seafood and 0.34 µg kg-1 from dairy products. The total PAHs concentration was 1.06 µg kg-1 in seafood and 1.52 µg kg-1 in dairy products [37]. In 2018, hollow fiber supported ionic liquids liquid-phase micro-extraction method (IL-HF-LPME) followed by high-performance liquid chromatography was applied for the determination of 4 polycyclic aromatic hydrocarbons (PAHs) in milk samples. In the IL-HF-LPME method, a mixture of [OMIM]PF6 and lauric acid, in a ratio of 3:1, was immobilized in the pores of a polypropylene hollow fiber used as extraction solvent. A series of essential parameters influencing the extraction efficiency were investigated and optimized. Under the optimal conditions, the extraction equilibrium is achieved within 3 min, the linearity was >0.9990, the limits of detection varied from 0.14 to 0.71 ng mL-1, the limit of quantification values were between 0.4 and 1.8 ng mL-1, and the relative standard deviations were in the range of 1.24–3.27% (n = 5) and recoveries were between 93.6 and 102.8% [38]. In 2020, an MSPE/GC–MS method was used for the measuring of 16 PAHs from different types of dairy products. The limit of detection (LOD) and limit of quantitation LOQ were ranged between 0.040-0.075 and 0.121-0.227 μg kg-1, respectively. The highest mean of total PAHs was noted in milk powdered (2.28 ± 0.39 μg kg-1), while the lowest content was observed in pasteurized milk (0.87 ± 0.18 μg kg-1). Except for a few samples of milk powder, the PAHs contents of the other samples was lower than standard limits while the concentration of BaP was lower than of standard levels proposed by EU (0.02-0.06 μg kg-1) [8].
Conclusion
The guarantee of milk safety as a vital liquid food in healthy eating pyramid turns out to be mandatory. The subject of this study was to develop and improve an efficient and robust technique to concurrent extraction and designation of scarce concentration of 16 PAHs from milk as the main source of nutrients. DLLME as an easy and potent extraction procedure was successfully employed for the quick separation and pre-concentration of PAHs prior to GC-MS analysis. In addition, the main factors remarkably effected on DLLME performance was optimized. The proposed microextraction method could precisely analyze PAHs in cow milk samples containing high matrix-interferences. The consequences disclosed that this extraction procedure has many preponderances including, environmentally friendly, high recovery, good enrichment factor and low consumption volume of organic solvent. An implication of this finding is that this proposed approach has high capability to analyze the wide range of food-contaminants in the different food-matrices and dairy products. Also, the risk assessment of results can be considered in the future studies.
Acknowledgment
We thank the Research Council of Department of Food Science and Technology, Faculty of Nutrition Science, Food Science and Technology/National Nutrition and Food Technology Research Institute, Shahid Beheshti University of Medical Sciences, Iran, for their support in conducting this study.
Disclosure statement
No potential conflict of interest was reported by the author(s).
Funding
Not available.
- C E O’Neil, T A Nicklas, V L Fulgoni III (2018) Nutrients, 10: 1050.
- X Zhang, X Chen, Y Xu, J Yang, L Du, K Li, Y Zhou (2021) Nutrition & Metabolism, 18: 1-18.
- A T Usman, H O Abugu, C O B Okoye (2021) Journal of Environmental Health Science and Engineering, 19: 1523-1534.
- H I Abdel-Shafy, M S Mansour (2016) Egyptian Journal of Petroleum, 25: 107-123.
- C Torres-Moreno, L Puente-DelaCruz, G Codling, A L Villa, M Cobo, J Klanova, B Johnson-Restrepo (2022) Environmental Research, 204: 111981.
- F Barzegar, M Kamankesh, A Mohammadi (2023) Food Reviews International, 39: 1157-1183.
- Y Zhang, X Chen, Y Zhang (2021) Comprehensive Reviews in Food Science and Food Safety, 20: 1422-1456.
- N Shariatifar, M Dadgar, Y Fakhri, S Shahsavari, M Moazzen, M Ahmadloo, A Kiani, S Aeenehvand, S Nazmara, A M Khanegah (2020) Journal of Food Composition and Analysis, 85: 103331.
- L Palacios Colón, A J Rascón, E Ballesteros (2022) Foods, 11: 713.
- C M Iwegbue, J N Edeme, G O Tesi, F I Bassey, B S Martincigh, G E Nwajei (2014) Food and Chemical Toxicology, 72: 221-227.
- K Mastanjević, V Krstanović, D Kovačević, B Kartalović, K Habschied (2021) Beverages, 7: 58.
- T L Chung, C J Liao, M F Chen (2010) Journal of the Taiwan Institute of Chemical Engineers, 41: 178-183.
- I Gazioglu, O S Zengin, A Tartaglia, M Locatelli, K G Furton, A Kabir (2020) Analytical Letters, 54: 1683-1696.
- X Yang, Y Yin, Y Zong, T Wan, X Liao (2019) Microchemical Journal, 145: 26-34.
- Y Gao, Y Qin, F Xiong, L Zhao (2020) Journal of Separation Science, 43: 3940-3948.
- P L Peng, L H Lim (2022) Food Analytical Methods, 15: 1042-1061.
- L Ferey, N Delaunay, D N Rutledge, A Huertas, Y Raoul, P Gareil, J Vial (2013) Journal of Chromatography A, 1302: 181-190.
- L M Palm, D Carboo, P O Yeboah, W J Quasie, M A Gorleku, A Darko (2011) Advance Journal of Food Science and Technology, 3: 332-338.
- S Wu, W Yu (2012) Food Chemistry, 134: 597-601.
- X Q Yan, Y N Guo, S J Zheng, Q S Liu, J L Zhang (2021) Journal of Chromatography A, 1645: 462067.
- I Yebra-Pimentel, E Martínez-Carballo, J Regueiro, J Simal-Gándara (2013) Food Chemistry, 139: 1036-1043.
- G Wang, A S Lee, M Lewis, B Kamath, R K Archer (1999) Journal of Agricultural and Food Chemistry, 47: 1062-1066.
- C F Chiang, K C Hsu, T Y Tsai, C Y Cho, C H Hsu, D J Yang (2021) Food Chemistry, 334: 127471.
- M Rezaee, Y Assadi, M R M Hosseini, E Aghaee, F Ahmadi, S Berijani (2006) Journal of Chromatography A, 1116: 1-9.
- J Villacís-Chiriboga, G Jacobs, J Van Camp, K Elst, J Ruales, V Marcillo-Parra, V Böhm, A Bunea, M Cirlini, N Craft (2022) Journal of Food Composition and Analysis, 111: 104616.
- M K Chai, P D Chander, L S Wong (2016) Malaysian Journal of Analytical Sciences, 20: 14-20.
- R Ghiasi, A Mohammadi, M Kamankesh, F Barzegar, S Jazaeri (2022) Food Analytical Methods, 1-10.
- Z Temerdashev, S Prasad, T Musorina, T Chervonnaya, Z Arutyunyan (2022) Molecules, 27: 8586.
- N Omidi, F Barzegar, A S Abedi, M Kamankesh, K Ghanati, A Mohammadi (2021) Journal of Chromatographic Science, 59: 473-481.
- F Barzegar, M Kamankesh, A Mohammadi (2019) Journal of Food Measurement and Characterization, 13: 1755-1764.
- A Mohammadi, F Barzegar, M Kamankesh, A Mousavi Khaneghah (2020) Food Science & Nutrition, 8: 88-96.
- F Barzegar, N Omidi, M Kamankesh, A Mohammadi, R Ferdowsi, S Jazaeri (2019) Analytical Methods, 11: 942-949.
- E Oz (2021) International Journal of Food Science & Technology, 56: 954-964.
- B Akbari-Adergani, K Mahmood-Babooi, A Salehi, G J Khaniki, N Shariatifar, P Sadighara, T Zeinali (2021) Environmental Monitoring and Assessment, 193: 1-8.
- S Sahin, H I Ulusoy, S Alemdar, S Erdogan, S Agaoglu (2020) Food Science of Animal Resources, 40: 675.
- M Kazazic, M Djapo-Lavic, E Mehic, L Jesenkovic-Habul (2020) Chemistry and Ecology, 36: 726-732.
- S Y Lee, J Y Lee, H S Shin (2015) Toxicological Research, 31: 265-271.
- M Wang, C Cheng, C Liu, Y Yang (2018) Journal of Chromatographic Science, 56: 74-80.
FIGURE 1
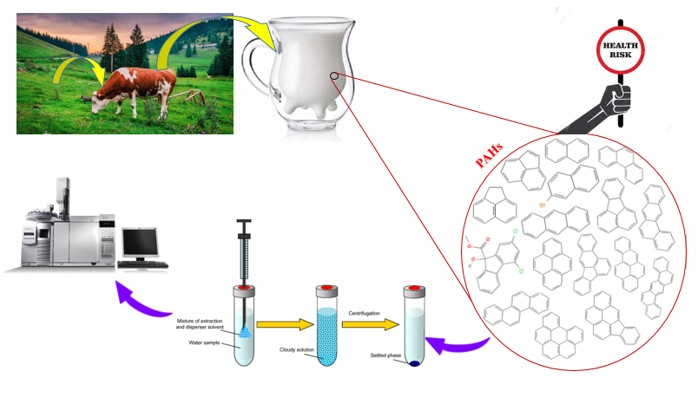
Graphical Abstract
FIGURE 2
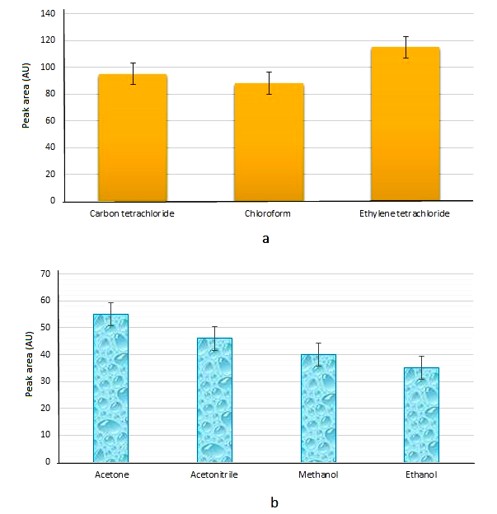
Figure 1: Optimization of extraction (a) and disperser (b) solvents types.
FIGURE 3
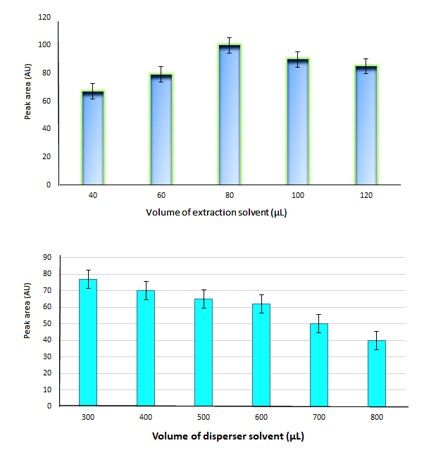
Figure 2: Optimization of volume of extraction (a) and disperser (b) solvents.
FIGURE 4
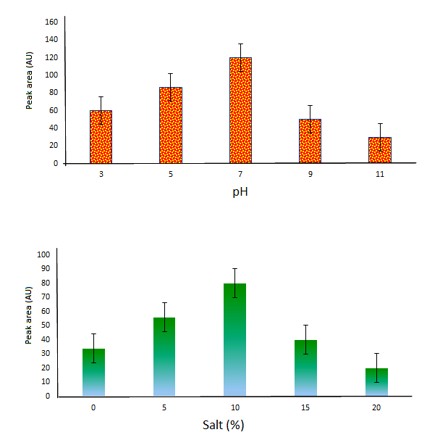
Figure 3: pH and salt percent optimization.
FIGURE 5
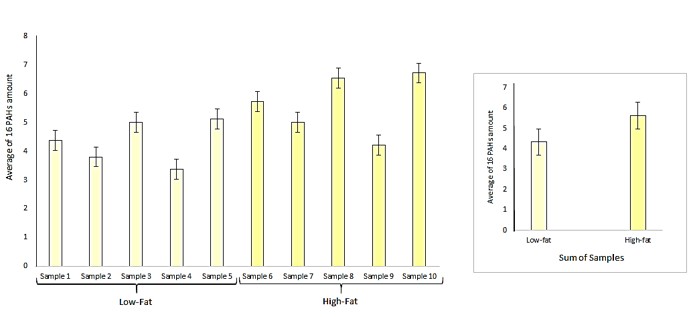
Figure 4: The present of the total amount of 16 PAHs in low-fat and high-fat milk samples
FIGURE 6
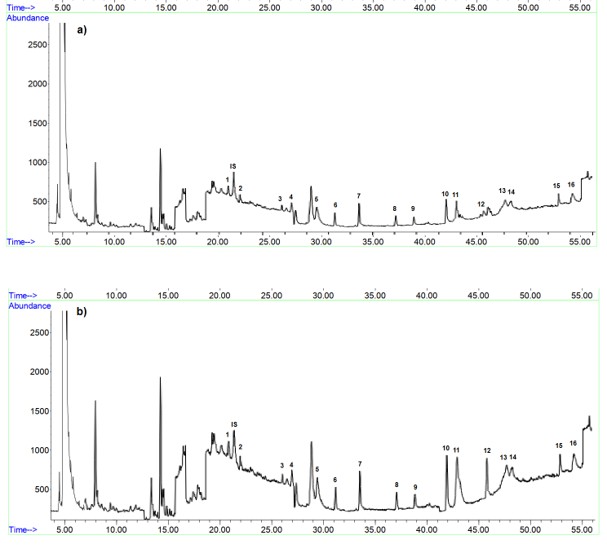
Figure 5: The chromatogram (a) non-spiked and (b) spiked (100 ng mL-1) high-fat milk sample under optimum condition. (1) Naphthalene, (IS) internal standard, (2) acenaphthylene, (3) 2-bromonaphthalene, (4) acenaphthene, (5) flurene, (6) phenanthrene, (7) anthracene, (8) fluoranthene, (9) pyrene, (10) benzo[a]anthracene, (11) chrysene, (12) benzo[b]fluoranthene, (13) benzo[a]pyrene, (14) indeno[1,2,3-cd]pyrene, (15) dibenzo[a,h]anthracene and (16) benzo[g,h,i]perylene.
Tables at a glance
Figures at a glance