
Drinking Yellow Pea-Based Milk (Pea Milk) Before Dinner Suppresses Postprandial Glucose Elevation: A Pilot Study
Received Date: October 19, 2026 Accepted Date: November 03, 2026 Published Date: November 06, 2026
doi:10.17303/jfn.2026.12.301
Citation: Hirofumi Masutomi, Hiroyuki Sasaki, Yuma Matsumoto, Katsuyuki Ishihara, Shigenobu Shibata, Akiko Furutani (2026) Drinking Yellow Pea-Based Milk (Pea Milk) Before Dinner Suppresses Postprandial Glucose Elevation: A Pilot Study. J Food Nutr 12: 1-16
Abstract
A new pea-derived plant-based milk (pea milk) drink has been developed, and its nutritional function is being explored. Previous study reported that consuming vegetable juice 30 minutes before a meal suppresses postprandial glucose increases, but no reports on plant-based milk have been published. We therefore hypothesized that consuming pea milk before a meal would have a similar effect. In addition, as dinner is associated with an increased glucose level compared to breakfast, we investigated the effect of consuming pea milk before dinner in terms of suppressing the subsequent increase in glucose levels. This study was an open-label randomized crossover study with five trials set up; pea milk 0, 15, 30, or 60 minutes before a meal and water as a control. Twenty-three healthy adult male and female participants were analyzed for this study. All participants wore a continuous glucose monitoring device, and they consumed pea milk or water before dinner served at 19:00. We analyzed the time course of the glucose levels, maximum glucose levels, and total area under the curve (total AUC).
Compared with no intake, pea milk consumed 60 min before dinner significantly attenuated postprandial glucose levels from 20:00 to 21:00. Pea milk consumed 15 min before dinner also reduced glucose levels at 20:00 and 20:15. Compared with no intake, pea milk consumption 30 and 15 min before dinner significantly reduced maximum postprandial glucose levels. Furthermore, total AUC was significantly lower in the 15-min pre-dinner intake group. The suppression of glucose levels was observed in males but not in females, suggesting that gender differences should be taken into account when conducting studies on blood glucose levels. Although the mechanism of action is unknown, it is suggested that taking pea milk before dinner may suppress the subsequent glucose increase.
Although 24 participants were recruited, only 23 were analyzed due to one exclusion. Sex-specific subgroup analyses were based on small samples (12 men and 11 women); therefore, the findings should be interpreted cautiously. This pilot study requires further research.
Keywords: Pea Milk; Plant-Based Milk; Postprandial Glucose Elevation; Gender
Introduction
In recent years, the market for plant-based milk has been expanding in Japan, following trends in the EU and the USA [1]. It has been reported that this increase in plant-based milk consumption is also related to sustainability and animal welfare considerations through decreasing the use of animal milk [2, 3]. Pulses are considered the most important raw material for plant-based milk analogues due to their high protein and nutritional value [4]. The most popular and commercially available plant-based milk substitute is soy milk [5]. Soybeans are one of the richest sources of protein among legumes, but soy allergies limit the intake of soy products [6]. Pea is gaining attention as it is becoming a promising alternative to soy in the production of plant-based milk analogues due to its hypoallergenicity, widespread availability and high nutritional value [7]. Milk made from yellow peas (pea milk) is one of the plant-based milks available on the market. Although there are several reports on its physical properties and odor, there have been almost no studies on its physiological function [4, 8, 9, 10]. As the simultaneous intake of pea protein and sugar suppresses blood glucose levels [11], yellow peas may help to attenuate sugar-induced high blood glucose levels. We have now developed a new pea milk in Japan and are exploring its effect on glucose levels.
When a blood glucose increase is maintained, insulin release is also maintained; such excessive insulin release results in the conversion of glucose to fat, leading to obesity [12]. Postprandial hyperglycemia and glucose spikes, which are rapid increases in postprandial blood glucose levels, even when fasting blood glucose levels are normal, are now known to be a risk factor for vascular disease [13, 14]. In addition, preventing sudden increases in blood glucose levels improves the prognosis of vascular diseases [15]. Thus, reducing the time for which the peak blood glucose level is maintained is important for glucose level management. Prolonged fasting is known to cause a sudden increase in blood glucose levels [16]; therefore, we should be careful about the glucose level when dinner time is delayed. Previous studies have shown that eating a snack between lunch and dinner can slow down the increase in blood glucose levels after dinner, as compared to not eating a snack, and this is known as the second meal effect [17]. The glucose level after dinner is significantly higher than that after breakfast, even when identical meals are consumed for breakfast and dinner [18]. Thus, in general, we should take care in managing glucose levels at dinner time. The second meal effect is a concept that was proposed by Jenkins et al. in 1982 [19]. The idea is that the first meal affects the postprandial blood glucose levels that occur after the second meal [20]. In recent years, research has been reported on the application of this second meal effect to beverages, showing that consuming vegetable juice suppresses subsequent increases in blood glucose levels [21]. In other words, drinking a beverage before a meal may be beneficial for controlling blood glucose levels.
It has been reported that males have higher fasting plasma glucose levels and a higher prevalence of subsequent glucose metabolism disorders than females [22, 23, 24, 25]. On the other hand, it has been reported that females often show higher blood glucose levels in the 75 g oral glucose tolerance test (OGTT) because of the differences in body size between males and females [22, 23, 25, 26]. It has also been reported that females have different blood glucose control during the follicular and luteal phases by sex hormones [27].
Therefore, in this study, we conducted an experiment based on the hypothesis that the newly developed pea milk may be able to suppress the subsequent increase in blood glucose levels if consumed before dinner. We also conducted a subgroup analysis focusing on gender.
Materials and Methods
Study Procedures
The subjects were recruited by Calbee, Inc., and were (1) healthy individuals aged 18 years or older who (2) provided written consent to participate in the study. However, the following individuals were excluded from the study: (1) individuals with allergies to the foods used in the study; (2) individuals with metabolic syndrome such as fasting high blood glucose levels (>110 mg/dl) and/or high body mass index (BMI) (>30 kg/m2), and/or medication of antihypertensive drugs; (3) individuals with severe liver disease, kidney disease, heart disease, lung disease, mental illness, or blood disease; (4) pregnant females or females who wish to become pregnant or breastfeeding females; and (5) individuals whom the principal investigator deemed inappropriate to participate in the study.
G*Power was used to determine the sample size. The effect size was calculated using one-way repeated ANOVA with an effect size of 0.4, alpha error of 0.05, and beta error of 0.8, the required sample size was calculated to be 24 participants. Based on this calculation, we recruited 24 subjects. The crossover trials were set up; one trial group drank water, and the other four trial groups drank pea milk. The control water group (also called the None group) drank water 0 minutes before dinner at 19:00; the pea milk groups drank the milk 60 minutes before at 18:00 (-60 min group), 30 minutes before at 18:30 (-30 min group), 15 minutes before at 18:45 (-15 min group), or immediately before at 19:00 (-0 min group) dinner. To eliminate bias due to the order of the test foods, five test groups were set up and 24 subjects were randomly assigned to consume the test foods in different orders (Figure 1). The subjects took lunch at 12:00–13:00 and drank water or pea milk between 18:00 and 19:00, with a prescribed dinner at 19:00. On the first day of the study, subjects were fitted with a continuous glucose monitoring (CGM) device (Freestyle Libre Pro, Abbott Japan LLC, Tokyo, Japan). After the CGM device was installed, an observation period of at least one day was set to stabilize the blood glucose monitoring [28]. The permitted meals were breakfast, lunch, and the prescribed dinner, and participants were permitted to drink water only from wake-up until 22:00; no other foods or drinks except for the experimental water and pea milk were permitted from lunch until the following morning. The washout period in this study is set to one day.
The information on the test foods in this study is as follows. Pea milk was purchased from Calbee Inc.'s e-commerce website. The water used is natural water from Suntory Ltd. The pea milk was a 200 mL drink containing 6.6 g pea protein, 4.7 g sugar (starch syrup and sucrose), and 4.6 g vegetable oil (Table S1). For dinner each of the five days, rice (Sato Foods Co., Ltd., Niigata, Japan), a main dish (hamburger steak set meal, Nichirei, Tokyo, Japan), and miso soup (Marukome, Tokyo, Japan) were prepared (Supplemental Table S1) as same contents, energy 602 kcal, protein 20.8 g, fat 14.7 g, carbohydrate 96.4 g.
This study was registered in the University Hospital Medical Information Network Clinical Trial Registry System (UMIN-CRT) (registration number: UMIN000054832) and was conducted in accordance with the Declaration of Helsinki and with respect to the human rights of the subjects. It was approved by the Aikoku Gakuen Junior College Ethics Committee (approval number: 2022-02). The subjects were given a verbal explanation of the outline, purpose, and contents of the survey and the protection of their personal information, and their written consent was obtained. At that time, it was explained to the subjects that all data obtained would be coded and individuals would not be identified, that the data would be analyzed collectively, that they would not be used for purposes other than research, that there would be no disadvantage for the subjects, and that participation in the study was voluntary.
Glucose Levels Measurement
The participants' glucose levels were monitored using the FreeStyle Libre Pro, a sensor that measures interstitial glucose levels every 15 minutes for 14 consecutive days. Blood glucose levels and interstitial glucose levels have been reported to correlate well [29]. The Freestyle Libre sensor is accurate in measuring glucose levels when compared to glucose levels measured by capillary self-monitoring of blood glucose testing and laboratory-obtained serum glucose in patients on HD [30]. Flash glucose monitoring using the Freestyle Libre can be a feasible alternative to reflect postprandial glycaemia (AUCs) in healthy adults [31]. It can be said that blood glucose assessment using Freestyle Libre has a certain degree of reliability. After the study was completed, the glucose sensors were collected, and the data were read using a dedicated device. The glucose levels were monitored and analyzed every 15 minutes from 60 minutes before (18:00) to 150 minutes after dinner (21:30). Analyses were performed on three parameters: (1) the glucose levels every 15 minutes until 18:00 to 21:30 pea milk, (2) the maximum glucose levels until 18:00 to 21:30, and (3) the total area under the curve (total AUC) until 18:00 to 21:30. The total AUC was calculated using the trapezoidal method. The primary objective of this study is to monitor real-time glucose dynamics using a CGM system.
Statistical Analysis
We used the Anderson-Darling test to check whether the data obtained followed a normal distribution, and then decided whether to conduct parametric or nonparametric tests. A two-way repeated analysis of variance was used to analyze the random glucose levels over time, and Dunnett’s test was used for multiple comparisons. Friedman ranks were used to analyze the maximum glucose levels and total AUC, and Dunn’s test was used for multiple comparisons. GraphPad Prism ver.8.4.3 was used as the statistical software for analysis; a significance trend was set at p < 0.10, with significance at p < 0.05.
Results
Glucose Levels Fluctuation Analysis
Twenty-four participants were randomly assigned to five groups (Group A-E) and participated in five crossover trials in which they consumed either water or pea milk drinks at different timepoints (Figure 1). All 24 subjects completed the study, but 1 subject was excluded from the analysis due to a CGM measurement error; therefore, the following analysis was performed on 23 subjects.
In the analysis of glucose levels, postprandial glucose increase after dinner following pea milk intake was lower in the -60 min group at 20:00, 20:15, 20:30, 20:45, and 21:00 compared to the None group (Figure 2A, Supplemental Table S2, 20:00; 156.6 ± 32.7 mg/dL, p<0.05, 20:15; 142.5 ± 34.7 mg/dL, p<0.01, 20:30; 130.9 ± 30.1 mg/dL, p<0.01, 20:45; 122.7 ± 23.0 mg/dL, p<0.01, 21:00; 117.6 ± 19.1 mg/dL, p<0.05). On the other hand, the glucose levels of pea milk intake in the -60 min group were higher at 18:15, 18:30 and 18:45 before dinner (18:15; 92.2 ± 8.1 mg/dL, p<0.05, 18:30; 96.5 ± 7.3 mg/dL, p<0.01, 18:45; 93.7 ± 7.4 mg/dL, p<0.01). In the -30 min group, the glucose level was higher at 18:45 before dinner and 19:00, 19:15 after dinner compared to the None group (18:45; 91.2 ± 9.2 mg/dL, p<0.05, 19:00; 100.8 ± 10.9 mg/dL, p<0.01, 19:15; 116.7 ± 16.2 mg/dL, p<0.05). In the -15 min group, the glucose level was lower at 20:00 and 20:15 after dinner compared to the None group (20:00; 147.6 ± 36.7 mg/dL, p<0.01, 20:15; 143.0 ± 37.0 mg/dL, p<0.05). On the other hand, the glucose levels of pea milk intake in the -15 min group were higher at 19:00 and 19:15 after dinner (19:00; 93.7 ± 9.5 mg/dL, p<0.05, 19:15; 115.0± 14.3 mg/dL, p<0.01). In the analysis of the maximum glucose levels, the -30 min and -15 min groups showed lower values compared to the None group (Figure 2B, Supplemental Table S3, None; 179.4 ± 32.7 mg/dL, -30 min group; 164.0 ± 28.2 mg/dL, p<0.05, -15 min group; 160.1 ± 30.4 mg/dL, p<0.01). In the analysis of the total AUC, the -15 min group showed a decrease when compared to the None group (Figure 2C, Supplemental Table S3, None; 26393 ± 3328 mg*min/dL, -15 min group; 24903 ± 3296 mg*min/dL, p<0.05).
Gender Differences in Glucose Levels Fluctuation Analysis
As mentioned above, there are gender differences in fasting blood glucose levels and OGTT results [22, 23, 25, 26]. Therefore, a subgroup analysis was conducted focusing on gender. In this analysis, there were three groups: 12 males, 11 females.
An analysis of the glucose levels in male participants showed that the -60 min group had lower values at 20:15, 20:30, and 20:45 after dinner compared to the None group (Figure 3A, Supplemental Table S4, 20:15; 145.8 ± 34.3 mg/dL, p<0.05, 20:30; 133.8 ± 29.3 mg/dL, p<0.05, 20:45; 123.3 ± 22.5 mg/dL, p<0.05). On the other hand, the glucose levels in males of pea milk intake in the -60 min group were higher at 18:15, 18:30 and -18:45 before dinner (18:15; 93.0 ± 8.3 mg/dL, p<0.01, 18:30; 97.8 ± 7.7 mg/dL, p<0.01, 18:45; 94.2 ± 5.2 mg/dL, p<0.01).The -30 min group had lower glucose values at 20:00, 20:15, 20:30, and 20:45 after dinner compared to the None group (20:00; 150.0 ± 29.8 mg/dL, p<0.05, 20:15; 143.7 ± 25.2 mg/dL, p<0.01, 20:30; 134.2 ± 19.7 mg/dL, p<0.01, 20:45; 124.0 ± 15.5 mg/dL, p<0.01). In the -30 min group, the glucose level in males was higher at 18:45 and 19:00 before dinner compared to the None group (18:45; 95.3 ± 9.7 mg/dL, p<0.05, 19:00; 104.4 ± 11.9 mg/dL, p<0.01). The -15 min group had lower values at 20:00 and 20:15 after dinner compared to the None group (20:00; 145.3 ± 39.8 mg/dL, p<0.05, 20:15; 140.6 ± 42.0 mg/dL, p<0.05). In the -30 min group, the glucose level in males was higher at 19:00 and 19:15 after dinner compared to the None group (19:00; 96.7 ± 11.4 mg/dL, p<0.01, 19:15; 119.8 ± 16.1 mg/dL, p<0.05). In the maximum glucose levels, males participants in the -30 min and -15 min groups had lower values than those in the None group (Figure 3B, Supplemental Table S5, None; 184.4 ± 29.1 mg/dL, -30 min group; 156.9 ± 26.8 mg/dL, p<0.01, -15 min group; 161.4 ± 34.7 mg/dL, p<0.05). In the total AUC, male in the -30 min and -15 min groups showed a tendency of a lower value when compared to those in the None group (Figure 3C, Table S5, None; 26858 ± 3120 mg*min/dL, -30 min group; 24883 ± 2663 mg*min/dL, p=0.06, -15 min group; 24806 ± 3494 mg*min/dL, p=0.07).
An analysis of the glucose levels in female participants showed that none of the groups had changed values after dinner compared to the None group (Figure 3D, Supplemental Table S6). Similarly, no differences were observed in maximum blood glucose levels and total AUC due to pea milk intake in females (Figure 3 F,G, Supplemental Table S5).
Discussion
In this study, pea milk intake before dinner suppressed the postprandial increase in glucose levels. Although there have been reports on the physical properties and smell of pea milk [4, 8, 9, 10], the present results are the first evidence that pea milk strongly attenuates glucose levels after dinner.
In a previous study, participants consumed vegetable juice before a meal, and the subsequent glucose increase was suppressed; the mechanism for this suppression was due to the dietary fiber in the vegetable juice [21]. In another report, the increase in glucose levels after eating biscuits was suppressed in groups who consumed a mulberry leaf drink or a young barley leaf drink, both of which are rich in dietary fiber [32]. Pea milk contained 0.4 g of dietary fiber, which is lower than the amounts found in previous studies, making it unlikely that the suppression of blood glucose levels is due to dietary fiber.
Pea protein has been reported to contain an α-glucosidase inhibitor in the intestinal brush border [33]. It has also been reported that the glycoprotein-2 isolated from peas inhibits the activity of α-amylase and α-glucosidase, resulting in incomplete starch digestion and reduced glucose absorption [34]. The peptides contained in pea protein enhance the secretion of glucagon-like peptide-1 (GLP-1), and the enhancement in insulin secretion caused by GLP-1 contributes to the suppression of blood glucose levels. The peptides contained in pea protein enhance the secretion of glucagon-like peptide-1 (GLP-1), and the enhancement in insulin secretion caused by GLP-1 contributes to the suppression of blood glucose levels. Examples of protein-targeted second meal effect studies include the following. In a study of T2D patients treated with metformin, the consumption of soy yogurt (30 g of soy beans and 75 g of yogurt) two hours before breakfast reduced the post-breakfast glucose increase by about 40% [35]. In healthy subjects, when 100 g of three different protein drinks (whey, egg white, and soy protein) were consumed 30 min before glucose loading, the iAUC was lower for the whey and soy proteins compared to the control drink [36]. When considering the second-meal effect with a focus on protein, it is important to consider the time of intake as well as the constituent raw materials in detail. In order to clarify pea milk’s mechanism of action, it is necessary to measure the activity of digestive enzymes and peptides contained in pea milk.
In previous study, we had reported the effect of sugar and carbohydrate amount on the second meal effect [37]. Insulin secretion is also affected by carbohydrate and sugar intake [38]. The 200 mL serving of pea milk consumed in this study contained 4.7 g of sugar (Supplemental Table S1). This study confirmed that consuming pea milk 30 and 15 minutes before a meal suppressed the rise in maximum postprandial glucose levels. In these groups, glucose levels at 19:00, the time when dinner begins, were significantly higher than in the None group. This mild preprandial hyperglycemia may have triggered early-phase insulin secretion (“priming effect”) and stimulated incretin release such as GLP-1, both of which contribute to blunting postprandial glucose excursions [39]. This mechanism is consistent with the concept of the “second meal effect,” where pre-meal intake of carbohydrates or protein lowers the glycemic response of the subsequent meal by stimulating insulin and incretin pathways in advance. Pea milk contains both sugar and pea protein, nutrients known to trigger these hormonal responses [11,40]. Thus, consuming pea milk prior to dinner may have functioned as a metabolic primer, helping attenuate the postprandial glucose peak. Future studies should include measurements of insulin, GLP-1, and gastric emptying to further elucidate these mechanisms.
Previous studies and this study, as well as other studies examining the second meal effect of beverages, have conducted the tests at dinner time. It has been pointed out that insulin resistance is higher in the evening compared to the morning, which may lead to a greater rise in blood sugar levels [18]. The glucose level after dinner is significantly higher than that after breakfast, even when identical meals are consumed for breakfast and dinner [18]. Consuming excess energy at a late dinner promotes glucose metabolism and lipid synthesis, increasing the risk of lifestyle-related diseases [41,42]. Previous reports have suggested that consuming a moderate amount of carbohydrates and/or sugar before a dinner meal can help lower blood glucose levels at dinner [37]. A 200 mL volume of pea milk contains 4.7 g of sugar (starch syrup and sucrose). The glucose levels of pea milk intake in the -60 min, -30 min, -15 min groups were higher before dinner, which is thought to be influenced by the sugars contained in pea milk. Although, it is possible that the sugar content of pea milk may be the cause of high glucose levels at 19:15 after dinner in -30 min and 15 min group. And it is possible that insulin might be secreted in advance due to this carbohydrate intake 15 minutes before dinner, which then contributed to the decrease in the maximum blood glucose level and total AUC after dinner. Pea milk may be beneficial as a way to control blood glucose levels after dinner.
In a study conducted on Japanese subjects to clarify the differences in glucose tolerance based on gender and age, apparent sex differences in glucose tolerance were observed. The difference is caused by decreased β-cell function represented by fasting plasma insulin levels, homeostasis model assessment-β (HOMA-β), and increased BMI [43]. Glucose tolerance was better in young females than in males, but the difference narrowed in middle-aged females [43]. It has been reported that early insulin secretion decreases with age, especially in females [44]. HOMA-β also declined with age [45]. The average age of the study participants was 38.1 ± 9.2 years for males and 42.5 ± 11.2 years for females, suggesting that insulin secretion and HOMA-β may decline with age. Females have different blood glucose control during the follicular and luteal phases by sex hormones [27]. It has been reported that, in females, blood glucose levels are less likely to increase during the follicular phase but more likely to increase during the luteal phase [46]. OGTT and insulin tolerance tests have also shown that hypoglycemia under insulin loading is reduced during the follicular phase, and glucose tolerance is slightly improved [47,48]. This is due to the increased secretion of progesterone during the luteal phase; progesterone is reported to increase insulin resistance, making blood glucose levels more likely to increase [49]. Conversely, estrogen and estrogen receptor alpha has been reported to promote insulin secretion, regulate glucose utilization, and improve insulin sensitivity. [50, 51]. Some reported indicate that amenorrhea symptoms are significantly correlated with insulin resistance [52]. The study included three females who menstruated during the study period and eight females who did not menstruate during the study period. These factors may be one of the reasons why pea milk did not have an effect of suppressing postprandial blood glucose elevation in females. In future studies, it will be necessary to design tests that take into account the effects of the menstrual cycle and sex hormone secretion.
Limitation
There are a number of research limitations in this study. Because this study was conducted in Japanese individuals and the intervention period was only single intake test, its application to a racial group other than the Japanese population and its contribution to a long-term strategy are unclear. No comparisons were made with other plant-based milks, so it is unclear whether the effects apply to all plant-based milks or if they are specific to pea milk. In this study, we only collected real-time blood glucose data using Libre pro, so we were unable to clarify the mechanism behind the reduction in blood glucose levels. In addition, it would be desirable to collect blood samples at various time points and measure blood glucose levels and related hormones such as GLP-1 and insulin to elucidate the mechanism of action. In order to clarify pea milk’s mechanism of action, it is necessary to measure the activity of digestive enzymes and peptides contained in pea milk. As the gender and age ranges were limited, it would be desirable to conduct tests taking age and gender into consideration in the future. Additionally, separate studies could be conducted on females at different stages of their menstrual cycle. The calculated sample size was 24 participants, and 24 participants were recruited. However, because one participant met the exclusion criteria, data from only 23 participants could be analyzed; therefore, the results should be interpreted with caution. Furthermore, the subgroup analysis by sex included 12 men and 11 women, and the results should be interpreted with even greater caution. Therefore, this study should be considered a pilot study, and further research is needed.
Conclusion
In this study, compared with no intake, pea milk consumed 60 min before dinner significantly attenuated postprandial glucose levels from 20:00 to 21:00. Pea milk consumed 15 min before dinner also reduced glucose levels at 20:00 and 20:15. Compared with no intake, pea milk consumption 30 and 15 min before dinner significantly reduced maximum postprandial glucose levels. Furthermore, total AUC was significantly lower in the 15-min pre-dinner intake group. This study suggests that consuming pea milk before dinner may suppress subsequent increases in glucose levels. The suppression of glucose levels was observed in males but not in females, suggesting that gender differences should be taken into account when conducting studies on blood glucose levels. Although the mechanism of action is unknown, these results may help understand the relationship between plant-based milks, including pea milk, and improved health. Although 24 participants were recruited, only 23 were analyzed due to one exclusion. Sex-specific subgroup analyses were based on small samples (12 men and 11 women) Therefore, this study should be regarded as a pilot study, and the results should be interpreted with utmost caution.
Author Contributions
Hirofumi Masutomi: Conceptualization, methodology, formal analysis, investigation, Writing - Original Draft, Visualization. Hiroyuki Sasaki: methodology, investigation, Writing - Original Draft. Yuma Matsumoto: methodology, investigation. Katsuyuki Ishihara: Writing - Review & Editing, supervision. Shigenobu Shibata: Writing - Review & Editing. Akiko Furutani: Conceptualization, supervision, project administration, Funding acquisition.
Conflicts of Interest
HM, HS, YM, and KI are employees of Calbee, Inc. SS and AF report no conflicts of interest pertaining to this work.
Sources of Funding
The study was conducted with funding from Calbee, Inc., Tokyo, Japan (No grant number).
- J-milk Gcjp (2023). https://www.j-milk.jp/report/ma rketing/Research202304.html#hdg4
- McCarthy KS, Parker M, Ameerally A (2017) Drivers of choice for fluid milk versus plant-based alternatives: What are consumer perceptions of fluid milk? J Dairy Sci 100: 6125-6138.
- Haas R, Schnepps A, Pichler A (2019) Cow Milk versus Plant-Based Milk Substitutes: A Comparison of Product Image and Motivational Structure of Consumption. Sustainability 11: 5046.
- Andaç AE, Tuncel NB, Tuncel NY (2024) Characterisation of Pea Milk Analogues Using Different Production Techniques. Food Technol Biotechnol 62: 177-187.
- Pua A, Tang VCY, Goh RMV (2022) Ingredients, Processing, and Fermentation: Addressing the Organoleptic Boundaries of Plant-Based Dairy Analogues. Foods 11.
- Cordle CT (2004) Soy protein allergy: incidence and relative severity. J Nutr 134: 1213s-1219s.
- Ma W, Zhang C, Kong X (2021) Effect of pea milk preparation on the quality of non-dairy yoghurts. Food Bioscience 44.
- Chen X, Niu H, McClements DJ (2024) Design and fabrication of plant-based milk fat globule mimetics: Flaxseed oil droplets coated with potato, soy, or pea protein. Food Res Int 197: 115175.
- Lao Y, Wang Y, Selomulya C (2024) Exploring the oil-water interfacial behaviour of pea protein-guar gum/gellan gum mixtures relating to stability and in vitro protein digestion of model pea milk system. Int J Biol Macromol 282: 136749.
- Sun R, Yang B, Yang C (2024) Reduction of Beany Flavor and Improvement of Nutritional Quality in Fermented Pea Milk: Based on Novel Bifidobacterium animalis subsp. lactis 80. Foods 13.
- Thondre PS, Achebe I, Sampson A (2021) Co-ingestion of NUTRALYS(®) pea protein and a high-carbohydrate beverage influences the glycaemic, insulinaemic, glucose-dependent insulinotropic polypeptide (GIP) and glucagon-like peptide-1 (GLP-1) responses: preliminary results of a randomised controlled trial. Eur J Nutr 60: 3085-3093.
- Ahmed B, Sultana R, Greene MW (2021) Adipose tissue and insulin resistance in obese. Biomed Pharmacother 137: 111315.
- Parkin CG, Buskirk A, Hinnen DA (2012) Results that matter: structured vs. unstructured self-monitoring of blood glucose in type 2 diabetes. Diabetes Res Clin Pract 97: 6-15.
- Hanssen NMJ, Kraakman MJ, Flynn MG (2020) Postprandial Glucose Spikes, an Important Contributor to Cardiovascular Disease in Diabetes? Front Cardiovasc Med 7: 570553.
- Brand-Miller J, Dickinson S, Barclay AW (2007) The glycemic index and cardiovascular disease risk. Curr Atheroscler Rep 9: 479-485.
- Kajiyama S, Imai S, Hashimoto Y (2018) Divided consumption of late-night-dinner improves glucose excursions in young healthy women: A randomized cross-over clinical trial. Diabetes Res Clin Pract 136: 78-84.
- Imai S, Kajiyama S, Hashimoto Y (2018) Consuming snacks mid-afternoon compared with just after lunch improves mean amplitude of glycaemic excursions in patients with type 2 diabetes: A randomized crossover clinical trial. Diabetes Metab 44: 482-487.
- Sonnier T, Rood J, Gimble JM (2014) Glycemic control is impaired in the evening in prediabetes through multiple diurnal rhythms. J Diabetes Complications 28: 836-843.
- Jenkins DJ, Wolever TM, Taylor RH (1982) Slow release dietary carbohydrate improves second meal tolerance. Am J Clin Nutr 35: 1339-1346.
- Wolever TM, Jenkins DJ, Ocana AM (1988) Second-meal effect: low-glycemic-index foods eaten at dinner improve subsequent breakfast glycemic response. Am J Clin Nutr 48: 1041-1047.
- Kasuya N, Okuyama M, Yoshida K (2016) Prior or Concomitant Drinking of Vegetable Juice with a Meal Attenuates Postprandial Blood Glucose Elevation in Healthy Young Adults. Food and Nutrition Sciences 7: 797-806.
- Faerch K, Borch-Johnsen K, Vaag A (2010) Sex differences in glucose levels: a consequence of physiology or methodological convenience? The Inter99 study. Diabetologia 53: 858-865.
- Sicree RA, Zimmet PZ, Dunstan DW (2008) Differences in height explain gender differences in the response to the oral glucose tolerance test- the AusDiab study. Diabet Med 25: 296-302.
- Vistisen D, Witte DR, Tabák AG (2014) Sex differences in glucose and insulin trajectories prior to diabetes diagnosis: the Whitehall II study. Acta Diabetol 51: 315-319.
- Williams JW, Zimmet PZ, Shaw JE (2003) Gender differences in the prevalence of impaired fasting glycaemia and impaired glucose tolerance in Mauritius. Does sex matter? Diabet Med 20: 915-920.
- Færch K, Pacini G, Nolan JJ (2013) Impact of glucose tolerance status, sex, and body size on glucose absorption patterns during OGTTs. Diabetes Care 36: 3691-3697.
- Zarei S, Mosalanejad L, Ghobadifar MA (2013) Blood glucose levels, insulin concentrations, and insulin resistance in healthy women and women with premenstrual syndrome: a comparative study. Clin Exp Reprod Med 40: 76-82.
- Hoss U, Budiman ES (2017) Factory-Calibrated Continuous Glucose Sensors: The Science Behind the Technology. Diabetes Technol Ther 19: S44-S50.
- Kumagai R, Muramatsu A, Fujii M (2019) Comparison of glucose monitoring between Freestyle Libre Pro and iPro2 in patients with diabetes mellitus. J Diabetes Investig 10: 851-856.
- Horne C, Cranston I, Amos M (2023) Accuracy of Continuous Glucose Monitoring in an Insulin-Treated Population Requiring Haemodialysis. J Diabetes Sci Technol 17: 971-975.
- Afeef S, Tolfrey K, Zakrzewski-Fruer JK (2023) Performance of the FreeStyle Libre Flash Glucose Monitoring System during an Oral Glucose Tolerance Test and Exercise in Healthy Adolescents. Sensors (Basel) 23.
- Kuwahara M, Kim HK, Ozaki M (2020) Consumption of Biscuits with a Beverage of Mulberry or Barley Leaves in the Afternoon Prevents Dinner-Induced High, but Not Low, Increases in Blood Glucose among Young Adults. Nutrients 12.
- Luhovyy BL, Kathirvel P (2022) Food proteins in the regulation of blood glucose control. Adv Food Nutr Res 102: 181-231.
- Liu JP, Qian YF, Qin GY (2021) Antidiabetic activities of glycoprotein from pea (Pisum sativum L.) in STZ-induced diabetic mice. Food Funct 12: 5087-5095.
- Chen MJ, Jovanovic A, Taylor R (2010) Utilizing the second-meal effect in type 2 diabetes: practical use of a soya-yogurt snack. Diabetes Care 33: 2552-2554.
- Silva Ton WT, das Graças de Almeida C, de Morais Cardoso L (2014) Effect of different protein types on second meal postprandial glycaemia in normal weight and normoglycemic subjects. Nutr Hosp 29: 553-558.
- Masutomi H, Mineshita Y, Ishihara K (2023) Effects of intake of four types of snack with different timings on postprandial glucose levels after dinner. Eur J Nutr 62: 2217-2231.
- Wolever TM, Bolognesi C (1996) Source and amount of carbohydrate affect postprandial glucose and insulin in normal subjects. J Nutr 126: 2798-2806.
- Zhao W, Zhou Y, Yuan Y (2020) Potato Preload Mitigated Postprandial Glycemic Excursion in Healthy Subjects: An Acute Randomized Trial. Nutrients 12.
- Zhang M, Zhu L, Zhang H (2024) Pea protein hydrolysate stimulates GLP-1 secretion in NCI-H716 cells via simultaneously activating the sensing receptors CaSR and PepT1. Food Funct 15: 10316-10322.
- Garaulet M, Lopez-Minguez J, Dashti HS (2022) Interplay of Dinner Timing and MTNR1B Type 2 Diabetes Risk Variant on Glucose Tolerance and Insulin Secretion: A Randomized Crossover Trial. Diabetes Care 45: 512-519.
- Gu C, Brereton N, Schweitzer A (2020) Metabolic Effects of Late Dinner in Healthy Volunteers-A Randomized Crossover Clinical Trial. J Clin Endocrinol Metab 105: 2789-2802.
- Yoshida A, Kimura T, Tsunekawa K (2022) Age-Related Sex Differences in Glucose Tolerance by 75 g Oral Glucose Tolerance Test in Japanese. Nutrients 14.
- Tura A, Pacini G, Moro E (2018) Sex- and age-related differences of metabolic parameters in impaired glucose metabolism and type 2 diabetes compared to normal glucose tolerance. Diabetes Res Clin Pract 146: 67-75.
- Chiu KC, Lee NP, Cohan P (2000) Beta cell function declines with age in glucose tolerant Caucasians. Clin Endocrinol (Oxf) 53: 569-575.
- Sato A, Uchigata Y, Yokoyama H (1999) Insulin Sensitivity During Menstrual Cycle in Women with Insulin-Dependent Diabetes Mellitus. Journal of the Japan Diabetes Society 42: 977-981.
- Fioretti P, Genazzani AR, Felber JP (1975) Glucose and insulin tolerance throughout the menstrual cycle. Acta Eur Fertil 6: 63-71.
- Diamond MP, Simonson DC, DeFronzo RA (1989) Menstrual cyclicity has a profound effect on glucose homeostasis. Fertil Steril 52: 204-208.
- Escalante Pulido JM, Alpizar Salazar M (1999) Changes in insulin sensitivity, secretion and glucose effectiveness during menstrual cycle. Arch Med Res 30: 19-22.
- Mauvais-Jarvis F, Clegg DJ, Hevener AL (2013) The role of estrogens in control of energy balance and glucose homeostasis. Endocr Rev 34: 309-338.
- Alemany M (2021) Estrogens and the regulation of glucose metabolism. World J Diabetes 12: 1622-1654.
- González Centeno A, Nahum Hernández P, Mendoza R et al. (2003) [Correlation between menstruation disorders and insulin resistance]. Ginecol Obstet Mex 71: 312-317.
FIGURE 1
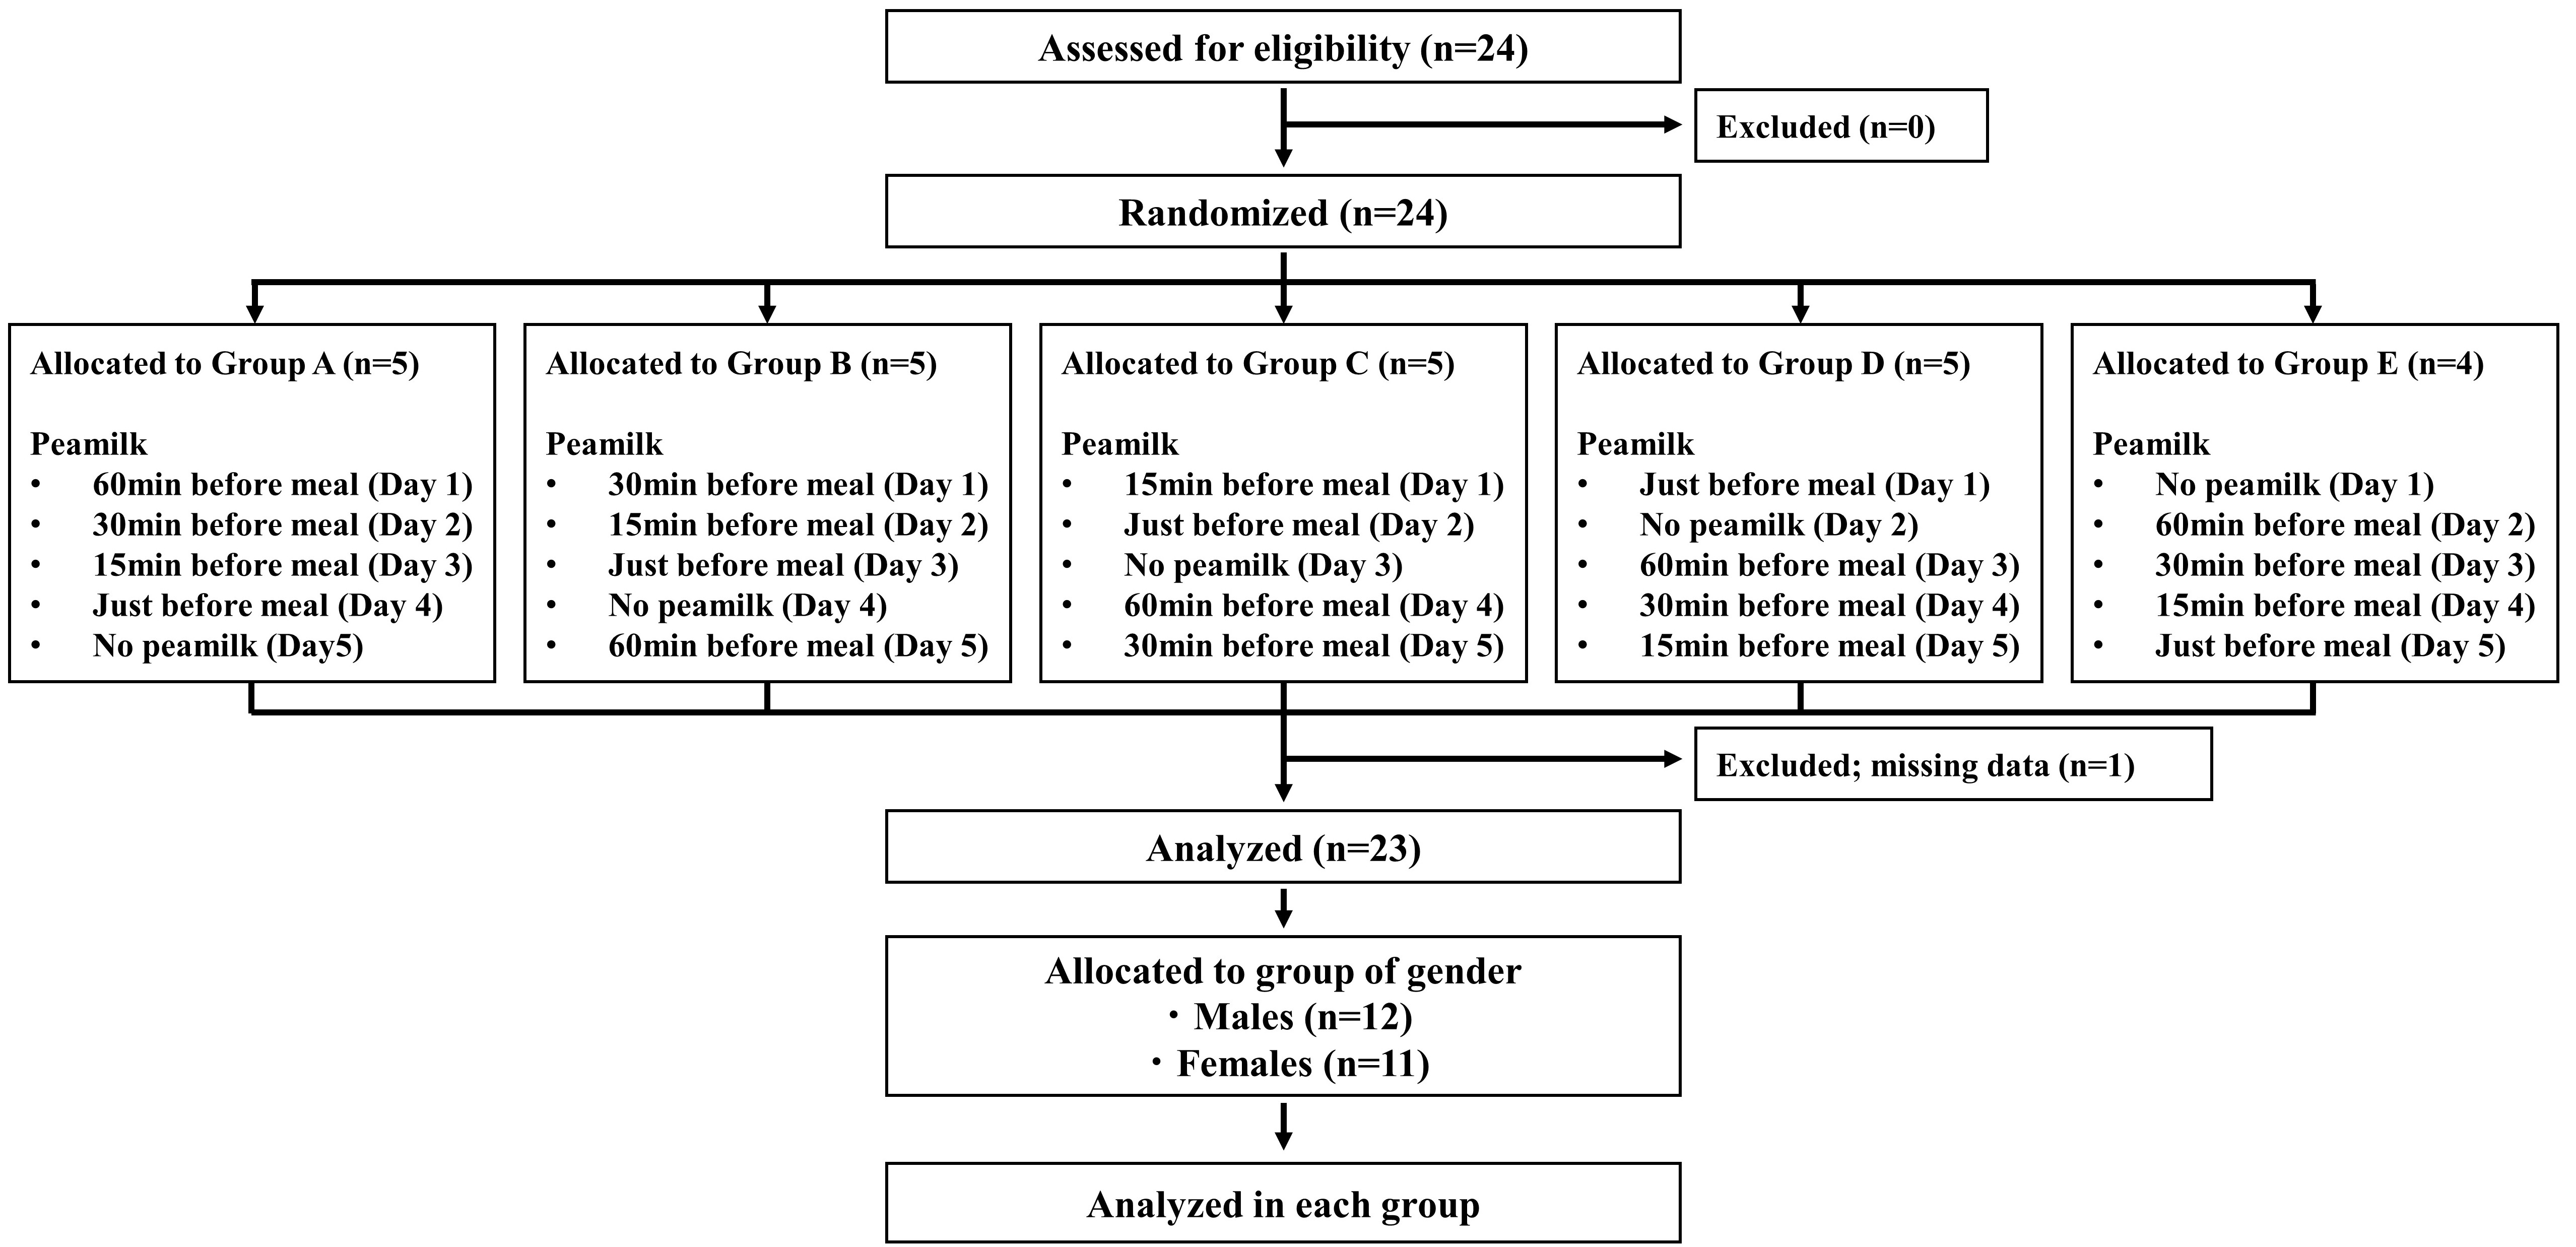
Figure 1: Flow Chart Showing Subject Classification
Values are the means ± standard deviations. BMI, body mass index.
FIGURE 2
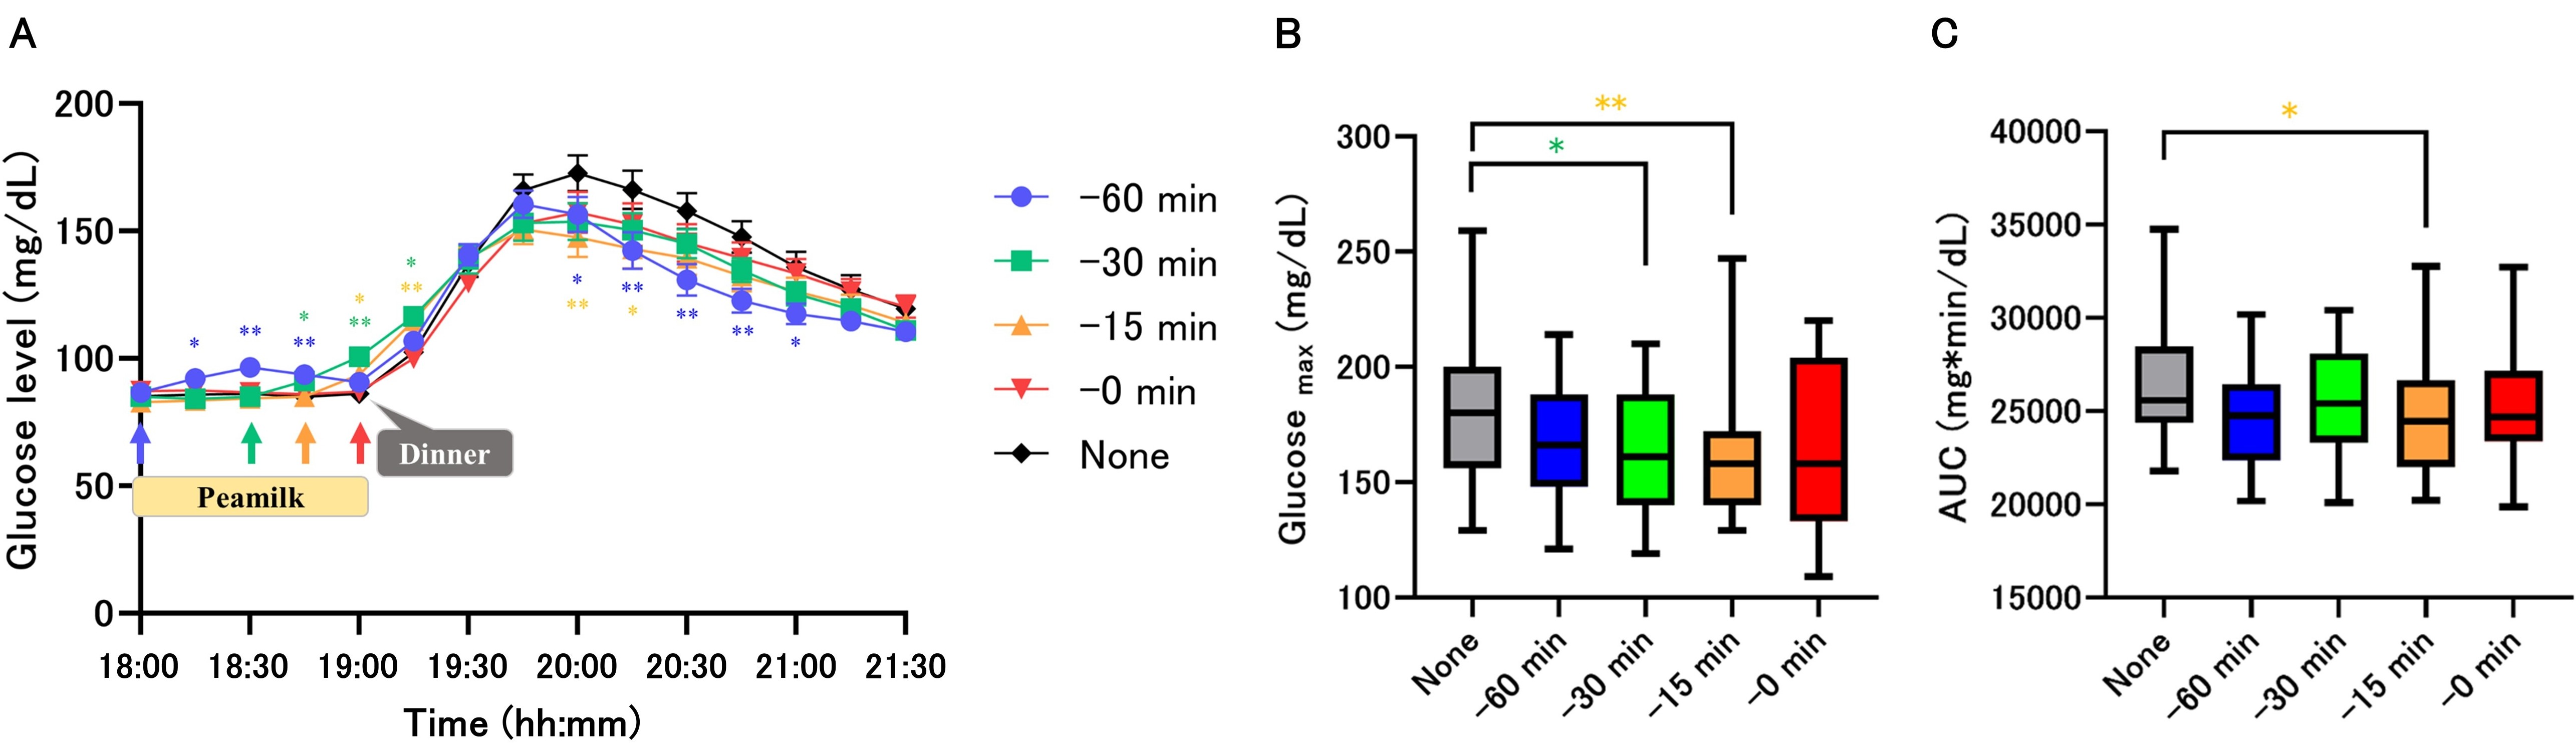
Figure 2: Response of glucose levels
Time course monitoring of glucose levels (A). Maximal glucose levels and AUCs of glucose levels (B, C). Glucose (mg/dL) was measured by FreeStyle Liber Pro. Values are means ± standard deviation. Monitoring of glucose levels, Two way-repeated-ANOVA was used for glucose data, and Dunnet's was used for multiple testing vs None group, * p < 0.05, ** p < 0.01. Maximal glucose and AUCs, Friedman test was used and Dunn's was used for multiple testing vs None group, * p < 0.05, ** p < 0.01. AUC, area under the curve of glucose.
FIGURE 3
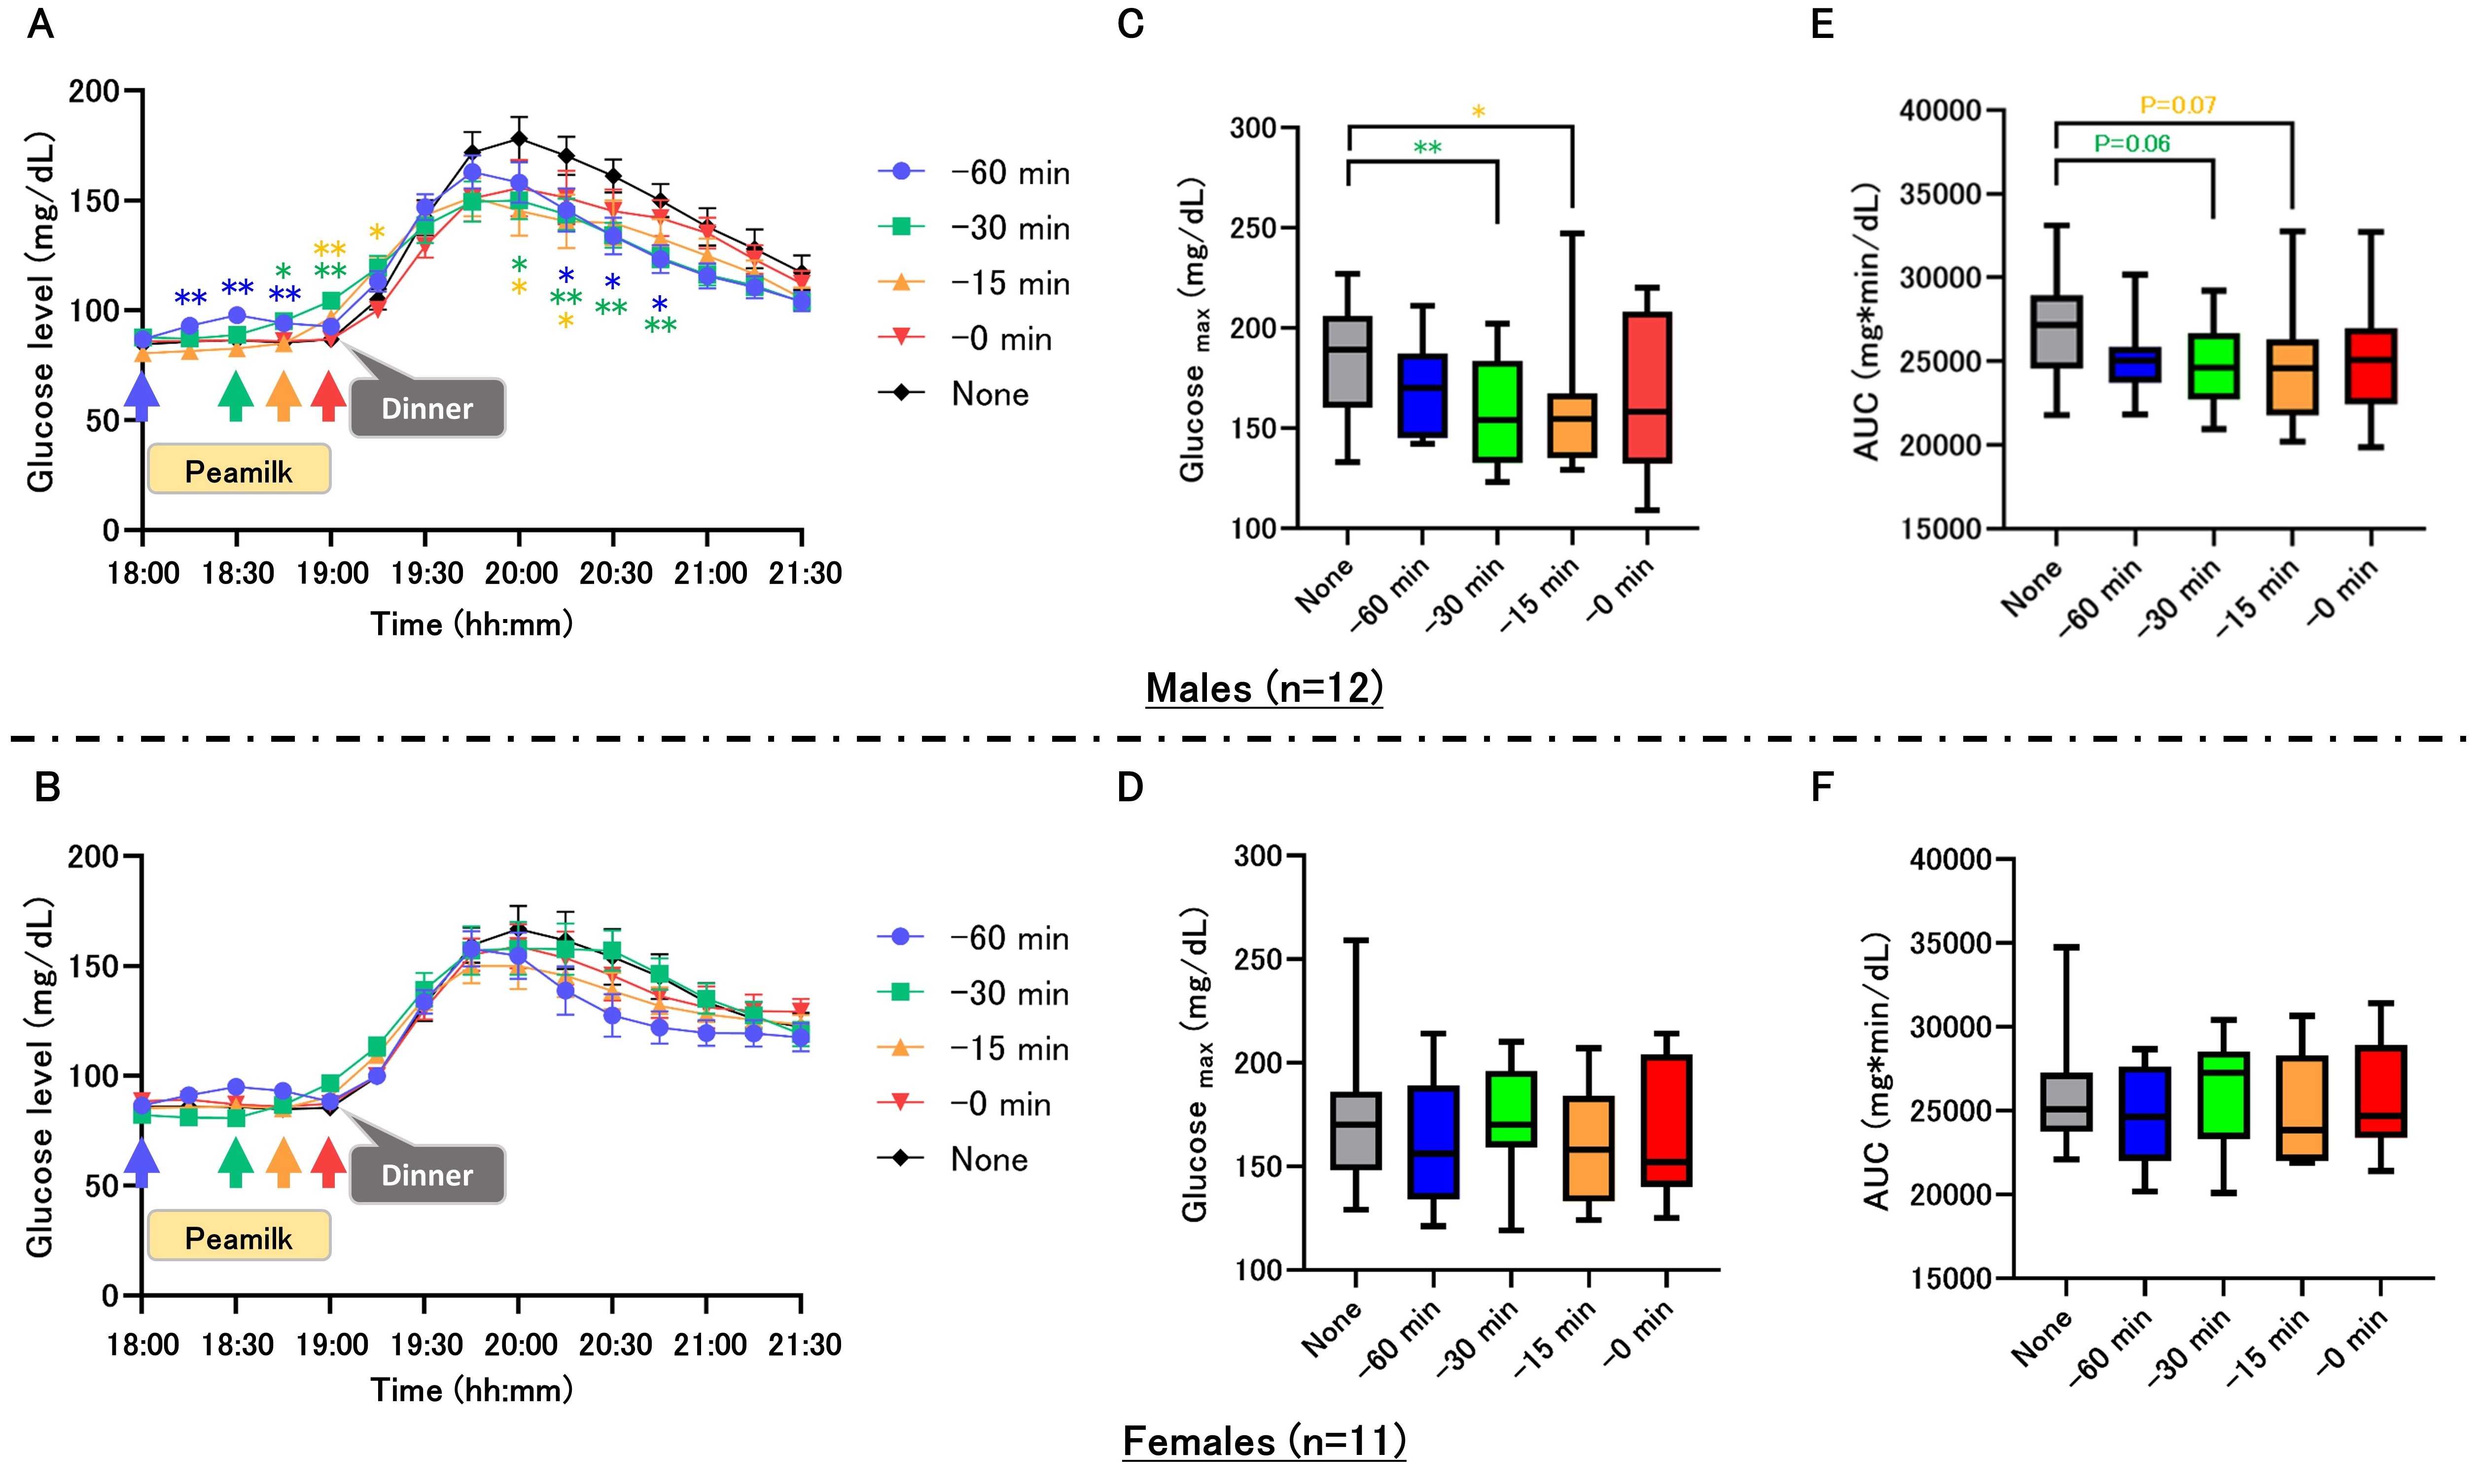
Figure 3: Gender differences in response of glucose levels
Time course monitoring of glucose levels (A–B). Values are means ± standard deviations. Maximal glucose levels and AUCs of glucose levels (C-F). AUC, area under the curve of glucose. Monitoring of glucose levels, Two way-repeated-ANOVA was used for glucose data, and Dunnet's was used for multiple testing vs None group, * p < 0.05, ** p < 0.01. Maximal glucose and AUCs, Friedman test was used and Dunn's was used for multiple testing vs None group, * p < 0.05, ** p < 0.01. AUC, area under the curve of glucose.
Tables at a glance
Figures at a glance