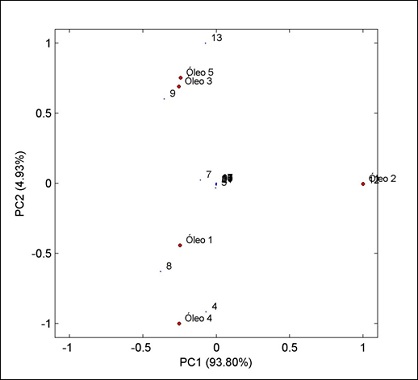
Figure 1 Principal component analysis of the lipid profile of Brazil nut oils.
Figure 1 Principal component analysis of the lipid profile of Brazil nut oils.
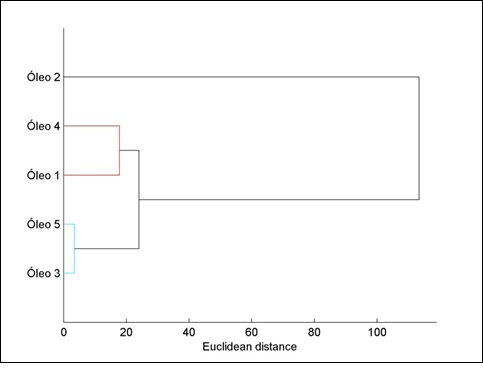
Figure 2 Grouping of Brazil nut oils according to their lipid profile
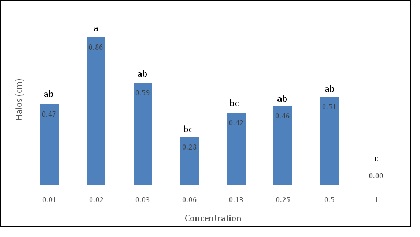
Figure 3 Diameter of inhibition halos under Brazil nut oil concentrations *Averages followed by the same letter do not differ from one another by the Tukey test (p<0.05).
FattyAcids |
Oils |
||||
1 |
2 |
3 |
4 |
5 |
|
Myristic |
0.050 |
- |
0.032 |
0.055 |
- |
Stearic |
0.058 |
0.001 |
- |
0.183 |
- |
Oleic |
0.289 |
0.003 |
0.340 |
0.434 |
0.192 |
Linolelaidic |
14.841 |
- |
- |
13.103 |
- |
Arachidic |
0.292 |
0.003 |
- |
1.026 |
0.603 |
Y- linolenic |
0.085 |
0.005 |
- |
- |
- |
Eicosanoic |
11.329 |
0.096 |
9.956 |
10.344 |
11.907 |
Linolenic |
34.667 |
0.308 |
35.675 |
48.066 |
33.508 |
Henecosanoic |
38.111 |
0.388 |
39.692 |
26.474 |
38.240 |
cis, 11 eicosanoisc |
0.182 |
- |
- |
- |
- |
cis 11,14,17 - eicosatrienoic |
0.096 |
0.001 |
- |
0.303 |
0.113 |
Tridecanoic |
- |
99.058 |
- |
- |
- |
Linoleic |
- |
0.136 |
14.305 |
- |
15.350 |
cis 11, 14, eicosanoic |
- |
0.001 |
- |
- |
- |
Palmitic |
- |
- |
- |
0.012 |
- |
Behenic |
- |
- |
- |
- |
0.052 |
Eurucic |
- |
- |
- |
- |
0.034 |
Table 1: Characterization fatty acids in Brazil nut oil