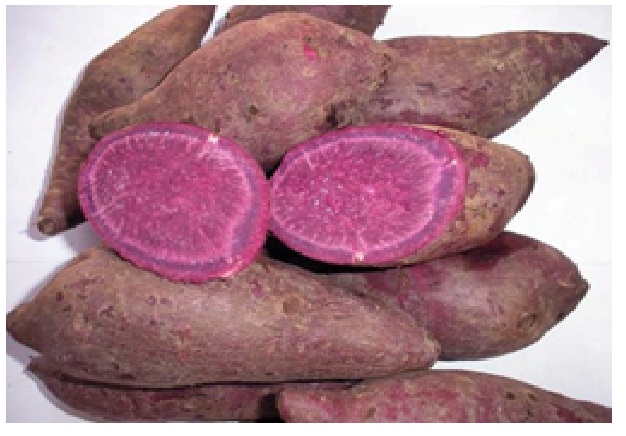
Figure 1 Purple sweet potatoes of variety HL 491 used in this study
Figure 1 Purple sweet potatoes of variety HL 491 used in this study
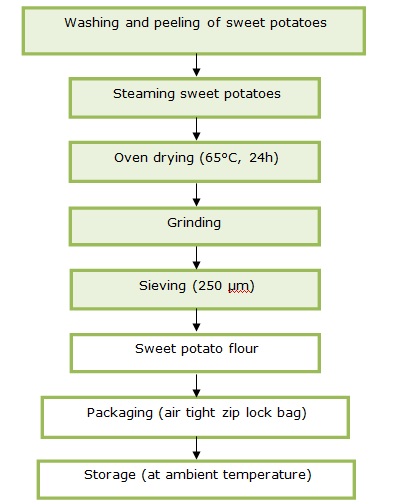
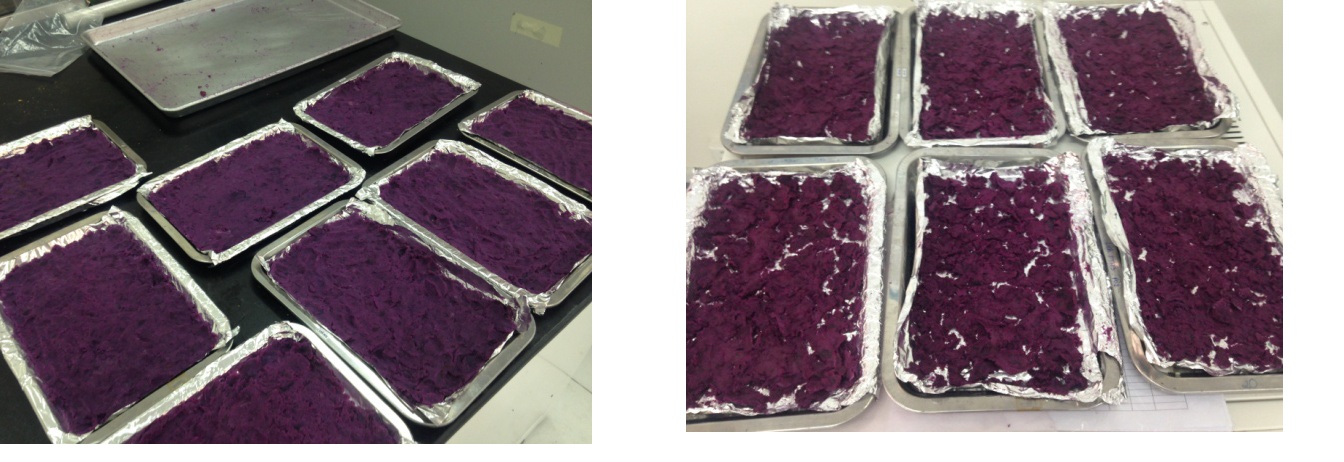
Figure 2 Flow chart for the preparation of sweet potato flour
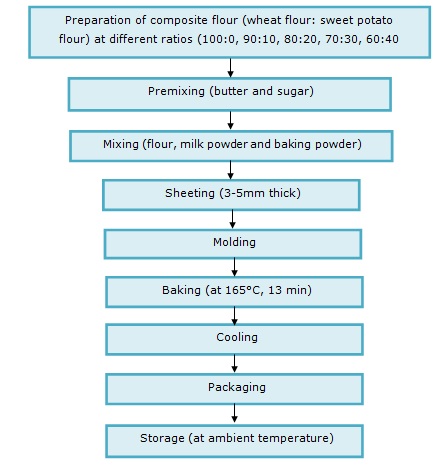
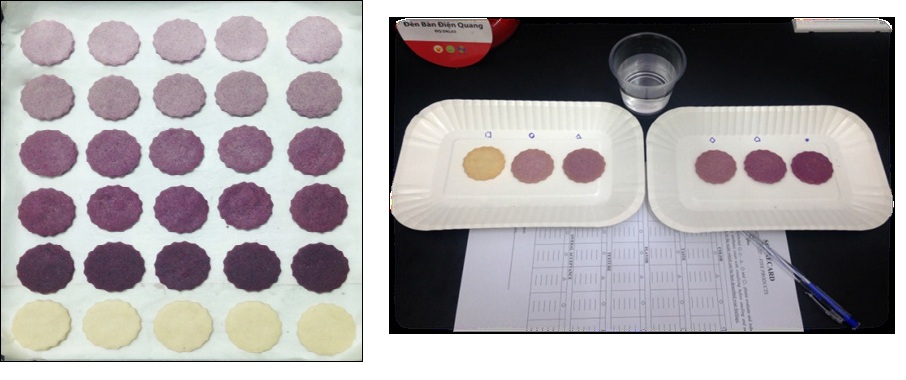
Figure 3 Flow chart for the preparation of biscuits
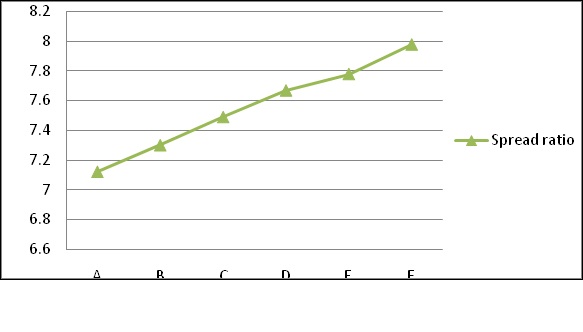
Figure 4 Effect of incorporating different levels of sweet potato flour on the spread ratio of biscuits.
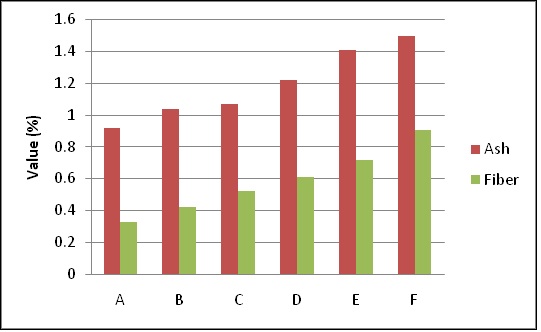
Figure 5 Effect of incorporating different ratio of sweet potato flour on the Ash and Fiber content of biscuits
Ingredients |
Samples (g) |
|||||
|
A |
B |
C |
D |
E |
F |
Wheat flour |
100 |
90 |
80 |
70 |
60 |
50 |
Sweet potato flour |
0 |
10 |
20 |
30 |
40 |
50 |
Powdered sugar |
15 |
15 |
15 |
15 |
15 |
15 |
Butter |
40 |
40 |
40 |
40 |
40 |
40 |
Baking powder |
1.5 |
1.5 |
1.5 |
1.5 |
1.5 |
1.5 |
Salt |
0.5 |
0.5 |
0.5 |
0.5 |
0.5 |
0.5 |
Table 1:Ingredients used in the preparation of biscuits
Components (%) |
Value* |
Moisture (d.w.b) |
7.14 ± 0.09 |
Ash |
1.98 ± 0.74 |
Fat |
0.44 ± 0.19 |
Protein |
2.48 ± 0.20 |
Crude fiber |
2.1 ± 0.00 |
Total carbohydrate |
85.80 ± 0.61 |
Table 2: Proximate values of purple sweet potato flour
*Values in the table represent the means ± standard deviations (n = 3 replicates) DWB = dry weight basis
Sample |
Bulk density (g/cm3) |
Water absorption Capacity (g/g) |
Oil absorption capacity (g/g) |
A |
0.69 ± 0.04a |
1.74 ± 0.06a |
2.23 ± 0.04a |
B |
0.70 ± 0.04a |
1.84 ± 0.05a |
2.21 ± 0.01ab |
C |
0.72 ± 0.01a |
1.89 ± 0.01a |
2.18 ± 0.01ab |
D |
0.73 ± 0.03a |
2.18 ± 0.04b |
2.17 ± 0.02ab |
E |
0.75 ± 0.02a |
2.39 ± 0.02c |
2.15 ± 0.01ab |
F |
0.77 ± 0.00a |
2.66 ± 0.08d |
2.13 ± 0.03b |
Table 3:Effect of incorporating sweet potato flour on the functional properties of the composite flours
*Values in the table represent the means ± standard deviations (n = 3 replicates) The values denoted by different letters in the same column are significantly different (p ≤0.05)
Physical property |
Value* |
Bulk density (g/cm3) |
0.94 ± 0.04 |
Water absorption capacity (g/g) |
2.76 ± 0.11 |
Oil absorption capacity (g/g) |
2.12 ± 0.03 |
Table 4:Functional properties of purple sweet potato flour
*Values in the table represent the means ± standard deviations (n = 3 replicates) The values denoted by different letters in the same column are significantly different (p ≤0.05)
Smpl |
Width |
Thickness (cm) |
Spread ratio |
Weight(g) |
Volume (cm3) |
Density (g/cm3) |
A |
4.09 ± 0.06a |
0.58 ± 0.01a |
7.12 ± 0.04a |
6.62 ± 0.03a |
7.56 ± 0.37a |
0.88 ± 0.05a |
B |
4.08 ± 0.08a |
0.56 ± 0.01ab |
7.30 ± 0.01b |
6.45 ± 0.07b |
7.28 ± 0.45a |
0.89 ± 0.04a |
C |
4.06 ± 0.08a |
0.54 ± 0.01abc |
7.49 ± 0.01c |
6.31 ± 0.03bc |
7.01 ± 0.44a |
0.91 ± 0.05a |
D |
4.06 ± 0.08a |
0.53 ± 0.01bc |
7.67 ± 0.07d |
6.13 ± 0.04d |
6.84 ± 0.35a |
0.90 ± 0.04a |
E |
4.07 ± 0.09a |
0.52 ± 0.01bc |
7.78 ± 0.06d |
6.16 ± 0.01cd |
6.79 ± 0.42a |
0.91 ± 0.06a |
F |
4.06 ± 0.08a |
0.51 ± 0.01c |
7.98 ± 0.02e |
6.07 ± 0.03d |
6.58 ± 0.42a |
0.93 ± 0.06a |
Table 5:Physical properties of developed biscuits
*Values in the table represent the means ± standard deviations (n = 3 replicates). The values denoted by different letters in the same column are significantly different (p ≤0.05)
Sample |
Moisture (%) |
Fat (%) |
Ash (%) |
Fiber (%) |
A |
5.96 ± 0.01a |
26.69 ± 0.87a |
0.92 ± 0.18a |
0.33 ± 0.04a |
B |
5.93 ± 0.01a |
26.51 ± 0.86a |
1.04 ± 0.13ab |
0.42 ± 0.03ab |
C |
5.81 ± 0.07a |
26.36 ± 0.87a |
1.07 ± 0.18ab |
0.52 ± 0.02bc |
D |
5.52 ± 0.06b |
26.25 ± 0.94a |
1.22 ± 0.02ab |
0.61 ± 0.01c |
E |
5.52 ± 0.03b |
25.69 ± 1.22a |
1.41 ± 0.03b |
0.72 ± 0.03d |
F |
4.89 ± 0.01c |
24.29 ± 1.46a |
1.50 ± 0.02b |
0.91 ± 0.01e |
Table 6:Proximate values of developed biscuits
*Values in the table represent the means ± standard deviations (n = 3 replicates). The values denoted by different letters in the same column are significantly different (p ≤0.05)
Sample |
Flavonoids (mg QE/g)* |
A |
4.80 ± 0.02a |
B |
5.25 ± 0.01b |
C |
6.07 ± 0.09c |
D |
6.36 ± 0.08d |
E |
6.45 ± 0.02d |
F |
7.51 ± 0.04e |
Table 7:Total Flavonoid Content of developed biscuits
QE = quercetin equivalence *Values in the table represent the means ± standard deviations (n = 3 replicates). The values denoted by different letters in the same column are significantly different (p ≤0.05)
Sample |
Color |
Taste |
Flavor |
Texture |
Overall acceptance |
A |
2.82a |
3.00a |
3.16a |
3.10a |
2.92a |
B |
3.00ab |
3.48ab |
3.44ab |
3.58a |
3.38ab |
C |
3.46bc |
3.64b |
3.62ab |
3.58a |
3.64b |
D |
3.72c |
3.96b |
3.96b |
3.50a |
3.80b |
E |
3.66c |
3.80b |
3.68ab |
3.54a |
3.80b |
F |
3.44bc |
3.68b |
3.60ab |
3.40a |
3.72b |
Table 8: Sensory evaluation scores of developed biscuits in term of color, taste, flavor, texture and overall acceptability in 5 - point scale.
*Average of 50 evaluations. The values denoted by different letters in the same column are significantly different (p ≤0.05)