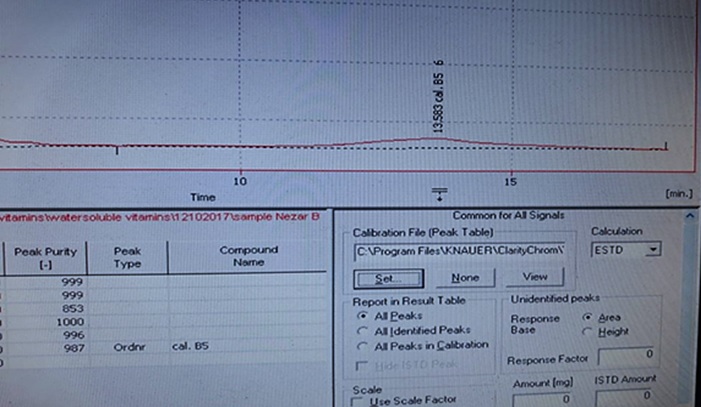
Figure 1: Graphical curve of vitamin b5
Figure 1: Graphical curve of vitamin b5
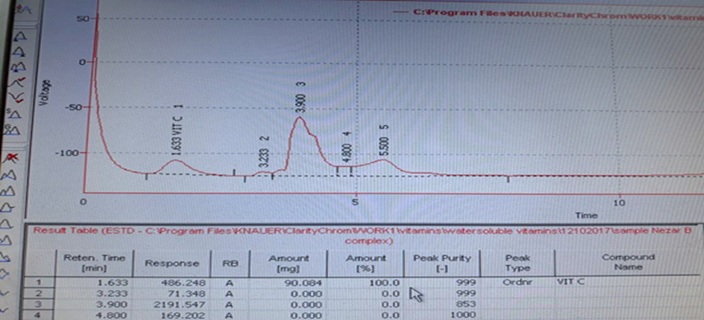
Figure 2: Graphical curve of vitamin c
Minerals and vitamins |
Daily recommended intake (mg) |
Percentage of ingredients in eggplant cones (mg /100g) |
Percentage of ingredients in edible part(mg /100g) |
Phosphorus |
1000 |
350 |
47 |
Magnesium |
410 |
180 |
15 |
Potassium |
3400 |
1400 |
2 |
Sodium |
2300 |
100 |
3 |
iron |
15 |
4.7 |
0.38 |
Zinc |
11 |
1 |
0.22 |
Manganese |
1.8-2.3 |
0.68 |
|
Calcium |
1300 |
450 |
18 |
Copper |
0 .9 |
0.46 |
0.12 |
Vitamin B5 |
5 |
7,3 |
|
Vitamin C |
75 |
45 |
12 |
Table 1: Comparison between Minerals and vitamins in edible part of eggplant [11], daily recommended intakes and Percentage of ingredients in eggplant cones