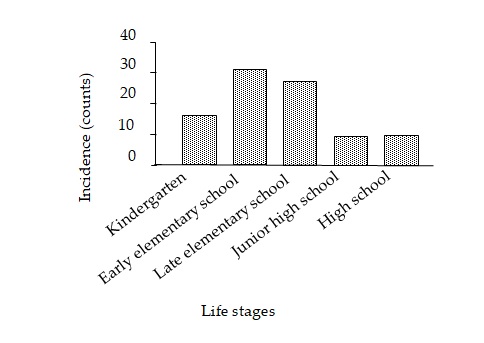
Figure 1: Comparison of incidence of the appearance of dislikes according to life stage (n=64).
Figure 1: Comparison of incidence of the appearance of dislikes according to life stage (n=64).
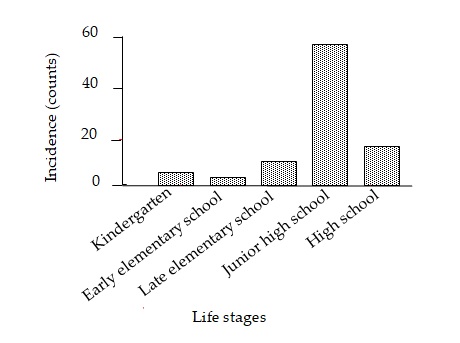
Figure 2: Comparison of incidence of disappearance of dislikes according to life stage (n=64).
Items |
Options |
Do you have dislikes? |
Yes, No. |
When did the appearance of dislikes occur? When did the disappearance of dislikes occur? |
The kindergarten (3-6 years old), Early elementary school (6-9 years old) Late elementary school (9-12 years old), Junior high school (12-15 years old), High school (15-18 years old), and University years (18-22 years old). |
Why did the disappearance of dislikes occur? |
I have a better understanding of the good taste of offensive foods and Free descriptive answer. |
Why did the appearance of dislikes occur? |
I felt ill after eating the food; I vomited when I ate the food; I disliked the taste of the food; I ate the food when I was sick, therefore, I disliked the food; I disliked the texture of the food;I disliked the smell of the food; I had abdominal pain when I ate the food; I disliked the appearance of the food; and Free descriptive answer. |
How often do you eat grain, potatoes, eggs, fish, meat, yellow vegetables, green vegetables, milk, beans products, seaweed, fruit, confectionery, beverages, and instant food products? |
You hardly eat at al:1, You eat once a week:2, You eat once a day:3, You eat three times a day:4. |
Table 1. Options and items on the questionnaire.
|
Subjects without dislikes |
Subjects with dislikes |
P* |
Numbers (percentage) |
16 (26) |
45 (74) |
<0.01 |
Table 2. The numbers and percentages of subjects with dislikes and subjects without dislikes.
Subjects were 61 female students. Sixty-four students participated. Three students did not respond. *probability calculated using the chi-square test in differences of the number of subjects. The numbers of subjects corresponding to dislikes were shown in the left column. The percentage (count/100 counts) of subjects corresponding to dislikes was shown in parentheses.
|
The numbers of subjects(count/100 counts) |
p* |
I felt ill after eating the food. |
8 (36) |
0.8 |
I disliked the taste of the food. |
3 (14) |
|
I disliked the texture of the food. |
3 (14) |
|
I disliked the smell of the food. |
2 (9) |
|
I vomited when I ate the food. |
2 (9) |
|
I disliked the appearance of the food. |
0 (0) |
|
Free descriptive answer |
|
|
I had gotten tired of eating the food. |
4 (18) |
|
Table 3.The numbers and percentage in respective reasons of subjects with reasons for the appearance of dislikes.
Subjects were 22 subjects with dislikes. Forty-five subjects had experienced the appearance of dislikes. Twenty-three participants did not respond.* probability calculated using the chi-square test in differences in the number of subjects among 7 variables. The numbers of subjects corresponding to the reason for the appearance of dislikes were shown in the left column. The percentages (count/100 counts) of subjects were shown in parentheses. Free descriptive answers of 7 existed. Three descriptive answers of them accorded to "I felt ill after eating the food." Accordingly, the 3 answers added in the option of "I felt ill after eating the food". The other answers of them were "I had gotten tired of eating the food."
Subjects without dislikes |
Subjects with dislikes |
p* |
|||
Mean |
SD |
Mean |
SD |
||
Grain |
5.8 |
0.6 |
5.4 |
0.8 |
0.1 |
Potatoes |
3.3 |
0.8 |
3.0 |
0.9 |
0.1 |
Eggs |
3.2 |
1.3 |
3.4 |
1.1 |
0.6 |
Fish |
3.2 |
0.8 |
3.1 |
0.9 |
0.7 |
Meat |
4.2 |
1.0 |
4.1 |
1.0 |
0.3 |
Green vegetables |
4.6 |
1.1 |
4.3 |
0.9 |
0.3 |
Yellow vegetables |
4.7 |
0.7 |
4.3 |
1.0 |
0.1 |
Milk |
4.0 |
1.1 |
4.1 |
0.9 |
0.7 |
$Bean products |
3.4 |
1.1 |
2.7 |
1.0 |
0.04 |
Seaweed |
3.5 |
1.0 |
3.2 |
1.1 |
0.2 |
Fruits |
3.6 |
0.8 |
2.8 |
1.2 |
0.01 |
Mushroom |
3.2 |
1.0 |
2.7 |
1.1 |
0.08 |
Oils |
3.2 |
1.2 |
3.7 |
1.3 |
0.2 |
Confectionaries |
2.8 |
1.0 |
3.6 |
1.1 |
0.01 |
Beverages |
2.8 |
1.1 |
3.3 |
1.2 |
0.1 |
Instant food |
2.2 |
1.3 |
2.0 |
1.0 |
0.5 |
Table 4. Comparison of the frequency of intake of different foods between subjects with dislikes and those without.
Subjects were 64 female students. All participants responded. Frequencies are presented as means and SD. Intake frequency was evaluated using a questionnaire. Answer options were as follows; Hardly eat at all: 1, Once a week: 2, Three times a week: 3, Once a day: 4, Twice a day: 5. $ Seasonings such asmiso and soy sauce were excluded.
|
The number of Subjects(count/100 counts) |
p* |
I have a better understanding of the good taste of offensive foods. |
28 (85) |
<0.001 |
Free descriptive answer |
|
|
I came to like the food that previously was offensive. |
3 (9) |
|
Cooking extinguished the dislikes naturally. |
1 (3) |
|
Table 5.The numbers and percentage in respective reasons of subjects with reasons for the disappearance of dislikes.
Subjects were 32 female students. Thirty-nine students had experience of disappearance of dislikes. Seven students did not respond. * probability calculated using the chi-square test in differences in the number of subjects among 3 items. The number of subjects corresponding to each reason for the disappearance of dislikes was shown in the left column. The percentage of subjects corresponding to the reason for the disappearance of dislikes was shown in parentheses. Free descriptive answers included 7 answers. Three descriptive answers of them accorded to "I have a better understanding of the good taste of offensive foods." The other descriptive answers included "I came to like the food that previously was offensive" and "Cooking extinguished the dislikes naturally".
Condition |
Conclusion |
Confidence |
Support |
Lift |
I eat eggs once a day. |
dislikes |
0.90 |
0.31 |
1.23 |
I eat grain twice a day. |
dislikes |
0.86 |
0.21 |
1.18 |
I eat meat once a day. |
dislikes |
0.84 |
0.26 |
1.14 |
I eat confectionary once a day. |
dislikes |
0.83 |
0.33 |
1.13 |
I eat beverages once a day. |
dislikes |
0.82 |
0.31 |
1.12 |
Results of the association rule analysis for the relations between likes and dislikes and frequency of food intake.
The law of dislikes affecting the frequency of food intake was analyzed using the association rules. Forty-two subjects without missing values out of 64 females were analyzed. Support represents the probability that an item in the condition column and dislikes (column of conclusion) occur simultaneously. Confidence represents the probability that dislikes will occur when items in condition column occur. Lift represents how many times higher the probability that dislikes occurs when items in condition occur is than the probability that dislikes occurs without the condition.