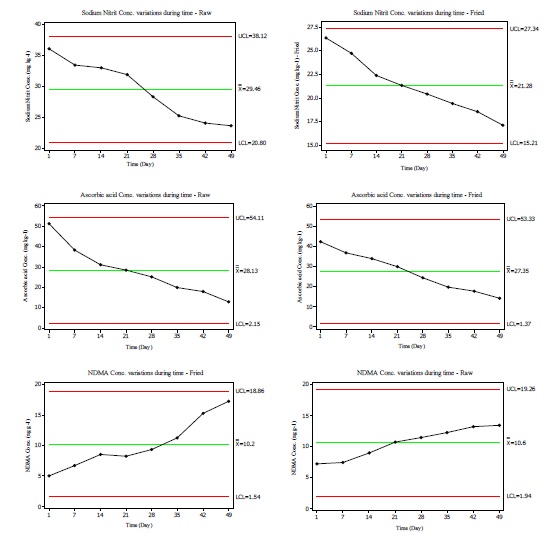
Figure 1 Ascorbic acid and sodium nitrite effect on nitrosamine formation in during time
Figure 1 Ascorbic acid and sodium nitrite effect on nitrosamine formation in during time
No. |
Name |
Polarity |
Boiling point (°C) |
CAS |
1 |
N-Nitrosodimethylamine (NDMA) |
log Kow*= -0.57 |
154.0 |
62-75-9 |
2 |
N-Nitrosomethylethylamine (NMEA) |
log Kow = 0.04 |
170.0 |
10595-95-6 |
3 |
N-Nitrosodiethylamine (NDEA) |
log Kow = 0.48 |
176.9 |
55-18-5 |
4 |
N-Nitrosodi-n-propylamine (NDPA) |
log Kow= 1.360 |
206.0 |
621-64-7 |
5 |
N-Nitrosodibutylamine (NDBA) |
log Kow = 2.63 |
237.0 |
924-16-3 |
6 |
N-Nitrosodiphenylamine (NDPhA) |
Log Kow= 3.13 |
268.0 |
86-30-6 |
7 |
1-Nitrosopiperidine (NPIP) |
log Kow = 0.36 |
219.0 |
100-75-4 |
8 |
1-Nitrosopyrrolidine (NPYR) |
log Kow = -0.19 |
214.0 |
930-55-2 |
9 |
Nitrosomorpholine (NMOR) |
log Kow = -0.44 |
225.0 |
59-89-2 |
*Kow's have redistributed from,30 |
||||
Table 1. Nitrosamines specifications
Operating parameters |
Values |
Injection volume (µL) |
2 |
Inlet temperature (oC) |
280 |
Flow (ml min-1) |
1.0 |
Temperature programming |
5 min isothermal at 60 °C, programmed to rise at 5 °C min-1 to 160 °C, rise at 20 °C min-1 to 240 °C,15 min isothermal at 240 °C |
Detector temperature (oC) |
300 |
Makeup-gas flow (N2) (mL min−1) |
20 |
Carrier gas |
Nitrogen |
Mode |
Pulsed splitless - Constant flow |
Table 2. Typical operating conditions for GC-FID.
Performance Characteristics |
||||||
Nitrosamine |
RT |
Linear dynamic range, LDR (mg L-1) |
The determination coefficient (R2) |
Limit of detection, LOD |
Limit of quantification, LOQ |
Relative standard deviation, RSD (%) |
NDMA |
11.5 |
1.0-10 |
0.997 |
0.4 |
1.0 |
7.2 |
NMEA |
12.6 |
1.0-10 |
0.989 |
0.4 |
1.0 |
8.6 |
NDEA |
13.3 |
1.0-10 |
0.988 |
0.4 |
1.0 |
8.2 |
NDPA |
16.7 |
1.0-10 |
0.984 |
0.4 |
1.0 |
10.5 |
NDBA |
21.0 |
2.0-10 |
0.982 |
0.7 |
2.0 |
11.7 |
NDPhA |
21.4 |
1.0-10 |
0.990 |
0.4 |
1.0 |
5.0 |
NPIP |
22.2 |
2.0-10 |
0.995 |
0.7 |
2.0 |
6.7 |
NPYR |
23.4 |
1.0-10 |
0.992 |
0.4 |
1.0 |
4.2 |
NMOR |
31.1 |
1.0-10 |
0.993 |
0.4 |
1.0 |
4.2 |
Table 3: Analytical performance data for nitrosamines determination.
N-nitrosamine |
Spiked Level(μg/L) |
Raw sausage |
Fried sausage |
||
Recovery |
%RSD |
Recovery |
%RSD |
||
NDMA |
1 5 10 |
70 85 95 |
5 4 3 |
72 83 97 |
5 4 3 |
NMEA |
1 5 10 |
68 87 92 |
5 5 3 |
70 85 95 |
6 4 5 |
NDEA |
1 5 10 |
71 85 95 |
4 5 3 |
68 85 95 |
6 3 4 |
NDPA |
1 5 10 |
70 85 95 |
6 4 3 |
67 83 96 |
4 4 3 |
NDBA |
5 10 |
85 92 |
5 3 |
85 95 |
4 3 |
NDPhA |
1 5 10 |
77 80 93 |
3 5 7 |
75 84 90 |
5 6 3 |
NPIP |
5 10 |
88 94 |
6 3 |
85 97 |
7 5 |
NPYR |
1 5 10 |
63 75 89 |
5 6 3 |
66 78 93 |
4 8 4 |
NMOR |
1 5 10 |
71 86 92 |
6 4 3 |
74 88 96 |
7 5 2 |
Table 4: Results of recoveries for nine spiked nitrosamines in sausage samples (n = 3).
Ref. |
Linear range (µg Kg-1) |
Real sample |
Recovery (%) |
Detection Limit (µg Kg-1) |
Quantitation limit (µg Kg-1) |
Method |
[3] |
0.25-500 |
Fast food, meat |
82-105.5 |
0.077-0.18 |
0.26 to 0.6 |
GC-NCD |
[35] |
- |
Potato |
103 |
0.001 |
0.003 |
GC-EID |
[18] |
- |
Sausages |
20-81.6 |
- |
400 |
SFE and MEKC |
[36] |
10000-200000 |
Water |
82-111 |
400-1600 |
0.13 |
GC-MS-PCI |
[6] |
0.25-500 |
Meat products |
60-105 |
0.01-0.12 |
0.03-0.36 |
SPE-GC-CI-MS |
[3] |
2-300 |
Meat products |
76-85 |
1.66–3.86 |
6.96-16.71 |
GC-GC-NCD |
[7] |
- |
Foodstuff |
80-120 |
0.10-0.30 |
- |
GC-PCI-MS/MS |
[1] |
1-100 |
Processed meats |
70-114 |
0.15-0.37 |
0.5-1.24 |
GC-MCI-MS |
[28] |
5-50 |
Food |
80-110 |
0.03-1.26 |
0.08-2.76 |
HPLC-APCI-MS/MS |
[37] |
0.3-100 |
Food products |
74-117 |
0.08-0.55 |
0.26-1.82 |
HPLC-UV |
[38] |
1-100 |
Processed meats |
70-114 |
0.15-0.37 |
0.50-1.24 |
GC-CI-MS |
[27] |
0.1-100 |
Water |
97.44-107.16 |
0.00078-0.0112 |
|
HS-SPME-GC-MS |
This work |
50-500000 |
Sausage |
63-97 |
0.4 |
0.5-1.0 |
GC-FID |
Table 5: Method analytical figures of merit for nitrosamines determination in sausage at a comparison to other methods