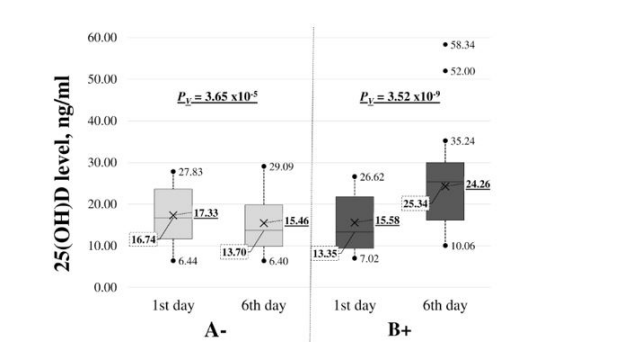
Figure 1: Changes in 25(OH)D, ng/ml, before and after (Day 1 and Day 6) in groups A - and B +. The graphic shows the median (boxing middle line; value in a dashed square) with quartile distribution in patients. The end of the dashed line outside boxing has a maximum and minimum value; outside the line is expressed in terms of outside the existing value; X – arithmetic mean (underlined); ΔD – the value of 25(OH)D change in each group; PV - statistical reliability for paired data with Wilcoxon signed-rank test; PMV – statistical reliability of the difference in delta medians between the two groups (A- vs B+) using the Mann-Whitney U test.
Tables at a glance
Figures at a glance