| Gross weight | No of cases in 2018 | No of cases in 2019 |
|---|---|---|
| <2g | 8138 | 6604 |
| 2-5 | 2801 | 2982 |
| 5-10 | 425 | 331 |
| 10-200 | 466 | 394 |
| >200 | 65 | 79 |
Table 1: Number of Heroin cases received according to the gross weight
| Pure heroin quantity | 2018 No of samples (%) |
2019 No of samples (%) |
|---|---|---|
| <500 mg | 2596 (69.10 %) | 2735 (72.24 %) |
| 500 mg – 1 g | 355 (9.4 %) | 303 (8.0 %) |
| 1 g – 2 g | 302 (8.1 %) | 275 (7.3 %) |
| 2 g – 5 g | 186 (5.0 %) | 149 (3.9 %) |
| >5 g | 275 (7.3 %) | 257 (6.8 %) |
| NEGATIVE | 43 (1.1 %) | 67 (1.8 %) |
Table 2: Quantifucation results of the sample
| Range of Pure Heroin Quantity | Number of Cases having gross weight 2 – 5 g |
Number of Cases having gross weight 5 – 10 g |
Number of Cases having gross weight 10 – 200 g |
Number of Cases having gross weight Over 200 g |
|---|---|---|---|---|
| <500 mg | 2390 | 165 | 40 | 1 |
| 500 mg – 1 g | 221 | 92 | 40 | 2 |
| 1 g – 2 g | 119 | 102 | 81 | 0 |
| 2 g – 5 g | 35 | 50 | 101 | 0 |
| >5 g | 0 | 16 | 200 | 59 |
| NEGATIVE | 36 | 0 | 4 | 3 |
Table 3: Variation of Pure Heroin Quantity with respect to the Gross Weight – 2018
| Range of Pure Heroin Quantity | Number of Cases having gross weight 2 – 5 g |
Number of Cases having gross weight 5 – 10 g |
Number of Cases having gross weight 10 – 200 g |
Number of Cases having gross weight Over 200 g |
|---|---|---|---|---|
| <500 mg | 2564 | 139 | 32 | 0 |
| 500 mg – 1 g | 190 | 75 | 38 | 0 |
| 1 g – 2 g | 144 | 65 | 66 | 0 |
| 2 g – 5 g | 29 | 42 | 74 | 4 |
| >5 g | 0 | 6 | 177 | 74 |
| NEGATIVE | 55 | 4 | 7 | 1 |
Table 4: Variation of Pure Heroin Quantity with respect to the Gross Weight – 2019
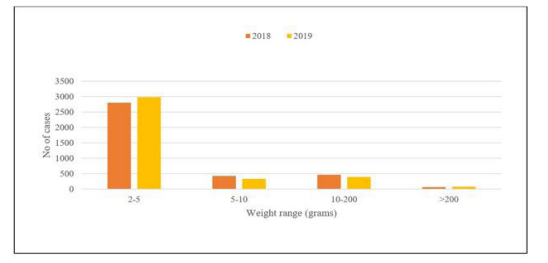
Figure 1: Number of Heroin cases received according to the gross weight
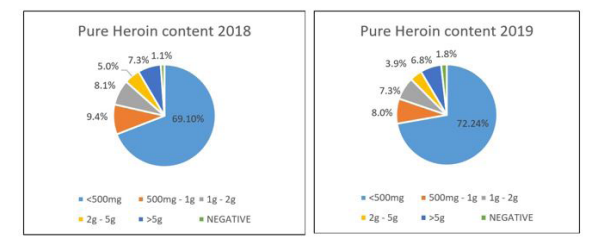
Figure 2: Quantification results of the samples
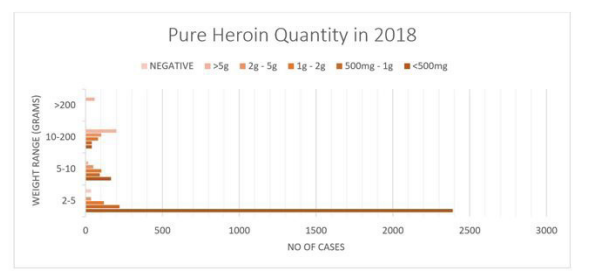
Figure 3: Variation of Pure Heroin Quantity with respect to the Gross Weight – 2018
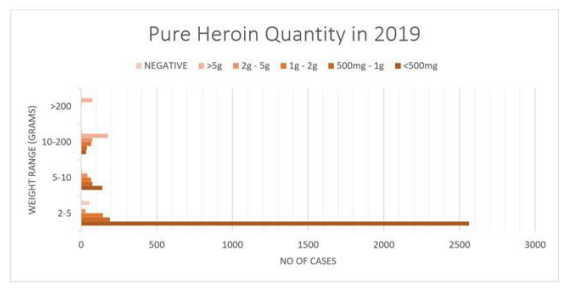
Figure 4: Variation of Pure Heroin Quantity with respect to the Gross Weight - 2019
Tables at a glance
Figures at a glance