Replicate1 |
Replicate2 |
Replicate2 |
|
Ct |
Qty |
|
Ct |
Qty |
|
Ct |
Qty |
Standard 1
|
22.81 |
13.25ng/pL |
Standard 1
|
22.48 |
13.25ng/pL |
Standard 1
|
21.94 |
13.25nghth |
Standard 2 |
25.18 |
5.3ng/p1 |
Standard 2 |
23.23 |
5.3ng/p1 |
Standard 2 |
23.63 |
5.3ng/pL |
Standard 3 |
26.01 |
2.65ng/p1 |
Standard 3 |
25.09 |
2.65ng/pL |
Standard 3 |
25.05 |
2.65ng/pL |
Standard 4 |
27.47 |
1.99ng/pL |
Standard 4 |
25.72 |
1.99ng/pL |
Standard 4 |
24.79 |
1.99ng/pL |
Positive control |
26.3 |
2.9 ing/pL |
Positive control |
25.72 |
1.77ng/pL |
Positive control |
25.99 |
1.19ng/pt
|
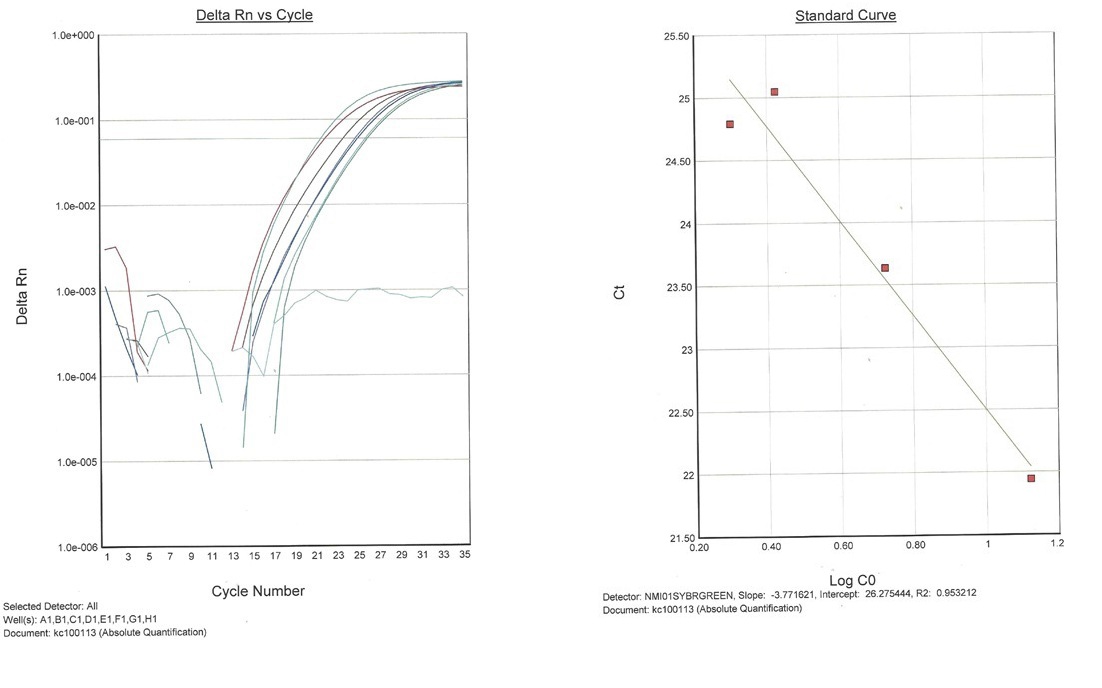
Standard Curve |
Standard Curve |
Standard Curve |
Slope: |
-5.21 |
Slope: |
-4.03 |
Slope: |
-3.77 |
R2 |
0.96 |
R2 |
0.935 |
R2 |
0.95 |
Table 1: Results for three replicate RT-PCR assays using the rbcL PCR primers for detection. Ct values represent the PCR cycle number at which the sample
crossed the analytical threshold of the amplification plot and Qty values represent the concentrations of the samples. Replicate 3 meets the quality control
criteria for the assay.
|
Sample |
Ct |
Qty |
Replicate3 |
MJ3 (marijuana |
21.5 |
18.43 ng/pl, |
MJ4 (marijuana) |
25.77 |
1.36 ng/pL |
|
MJ10 (marijuana) |
25.99 |
1.19 ng/pL |
Table 2: Results of the RT-PCR assay for detection of positive control (MJ10) and evidentiary marijuana samples (MJ3, MJ4). The Ct value represents the
cycle number at which the sample crossed the threshold of the amplification plot. The Qty value represents the calculated DNA concentration of each of the
samples when plotted against the wheat DNA standard curve.