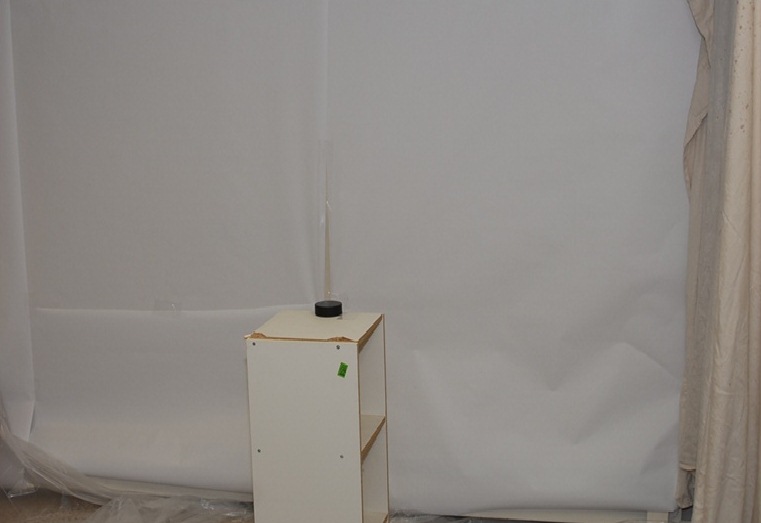
Figure 1 Depicts the initial set up
Figure 1 Depicts the initial set up
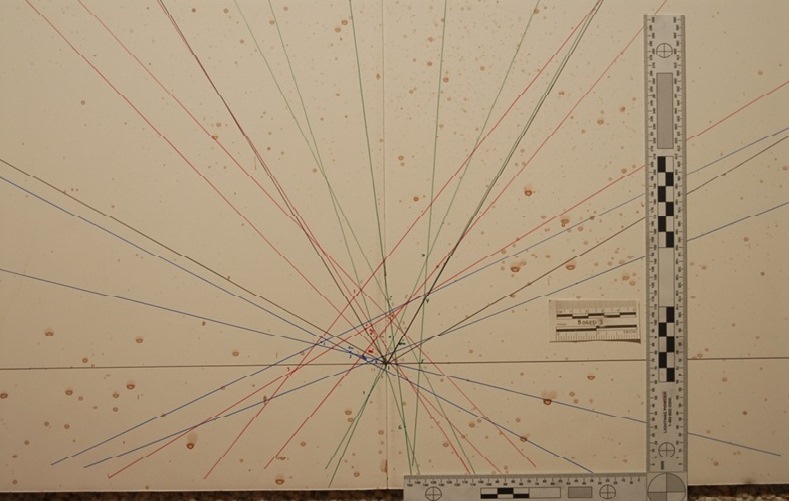
Figure 2 Depicts an example of AOC intersections, selected focal points, and the AOC average.
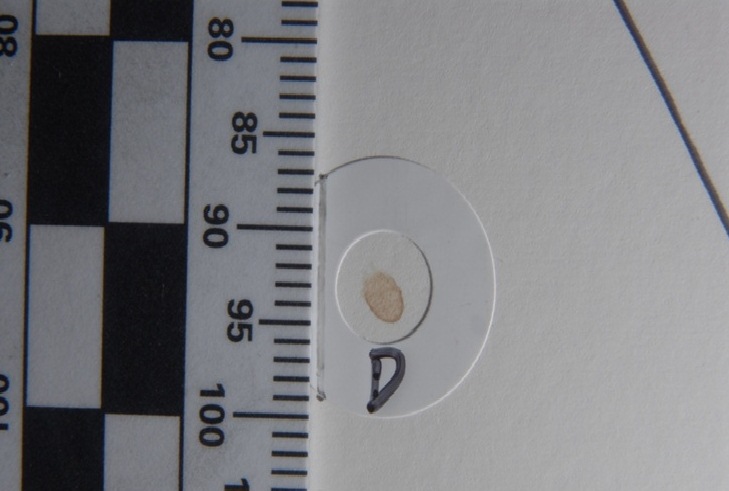
Figure 3 Depicts an example of a stain used for analysis.
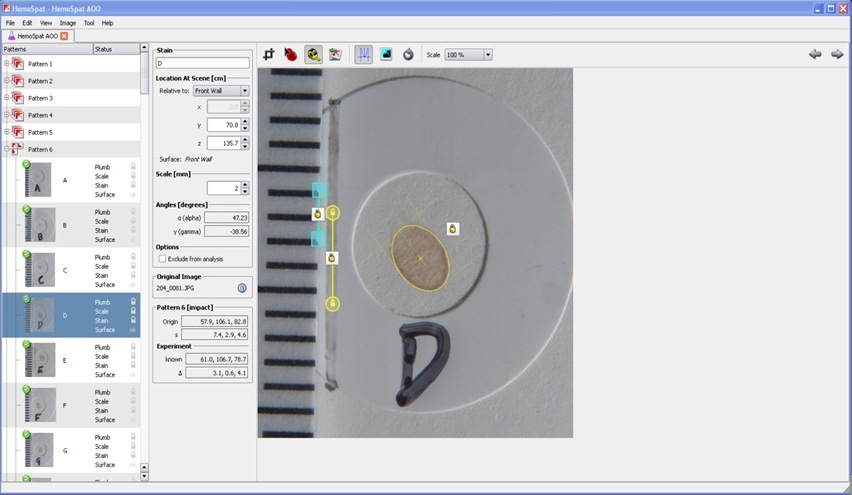
Figure 4 Depicts an example of the same stain, analyzed in HemoSpat.
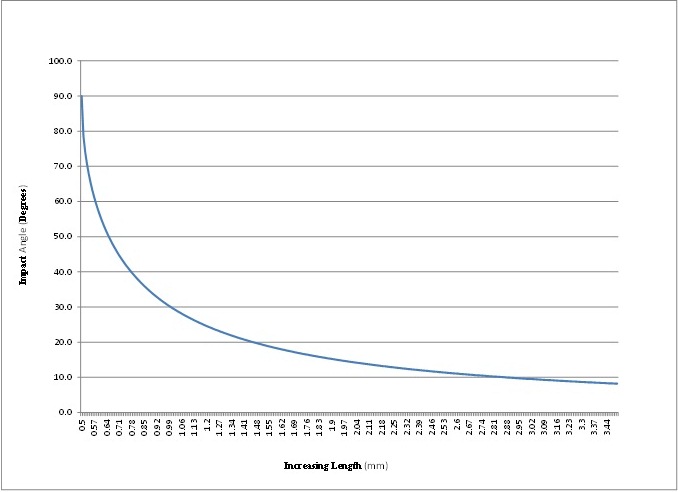
Figure 5 Depicts a graph of Impact Angle and Increasing Length with constant Width
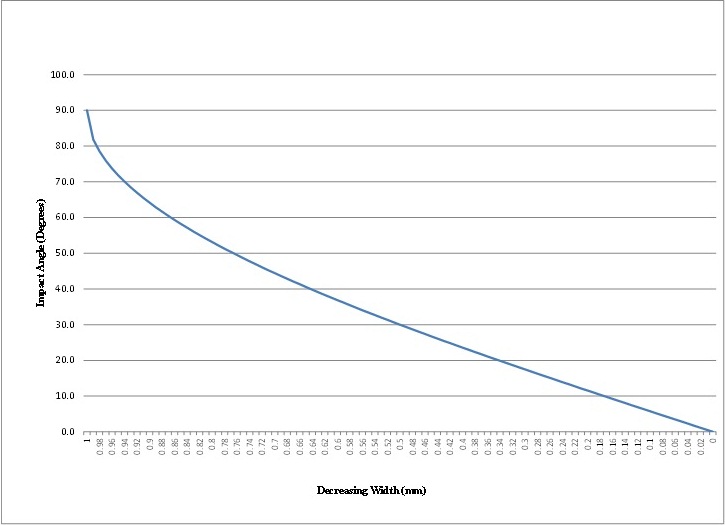
Figure 6 Depicts a graph of Impact Angle and Decreasing Width with constant Length
Method |
Impact Pattern |
X Value (In) |
Y Value (In) |
Z Value (In) |
Method |
Impact Pattern |
X Value (In) |
Y Value (In) |
Z Value (In) |
Tangent |
1 |
20.52 |
31.79 |
41.17 |
Tangent |
6 |
23.92 |
31.97 |
42.53 |
HemoSpat |
1 |
23.23 |
32.40 |
41.85 |
HemoSpat |
6 |
22.8 |
32.6 |
41.77 |
HemoSpat Scaled |
1 |
23.19 |
32.09 |
41.69 |
HemoSpat Scaled |
6 |
23.46 |
32.28 |
41.61 |
HemoSpat w. Measured Stains |
1 |
19.84 |
32.09 |
41.65 |
HemoSpat w. Measured Stains |
6 |
23.03 |
32.72 |
41.5 |
Tangent w. HemoSpat Stains |
1 |
23.89 |
31.79 |
41.17 |
Tangent w. HemoSpat Stains |
6 |
23.22 |
31.97 |
42.53 |
Tangent w. HemoSpat Scaled Stains |
1 |
23.84 |
31.79 |
41.17 |
Tangent w. HemoSpat Scaled Stains |
6 |
23.82 |
31.97 |
42.53 |
HemoSpat w. Measured Gamma |
1 |
23.78 |
31.77 |
41.65 |
HemoSpat w. Measured Gamma |
6 |
22.91 |
32.28 |
41.77 |
HemoSpat w. Meas Stains, Gamma |
1 |
20.28 |
31.61 |
41.46 |
HemoSpat w. Meas Stains, Gamma |
6 |
23.15 |
32.4 |
41.5 |
|
|
|
|
|
|
|
|
|
|
Tangent |
2 |
18.29 |
31.29 |
41.84 |
Tangent |
7 |
21.85 |
31.72 |
41.34 |
HemoSpat |
2 |
21.81 |
32.48 |
41.38 |
HemoSpat |
7 |
21.93 |
31.5 |
41.02 |
HemoSpat Scaled |
2 |
21.97 |
32.24 |
41.26 |
HemoSpat Scaled |
7 |
21.69 |
31.73 |
41.06 |
HemoSpat w. Measured Stains |
2 |
16.93 |
33.23 |
41.61 |
HemoSpat w. Measured Stains |
7 |
21.46 |
31.26 |
41.38 |
Tangent w. HemoSpat Stains |
2 |
22.62 |
31.29 |
41.84 |
Tangent w. HemoSpat Stains |
7 |
22.07 |
31.72 |
41.34 |
Tangent w. HemoSpat Scaled Stains |
2 |
22.78 |
31.29 |
41.84 |
Tangent w. HemoSpat Scaled Stains |
7 |
21.88 |
31.72 |
41.34 |
HemoSpat w. Measured Gamma |
2 |
22.76 |
31.06 |
41.38 |
HemoSpat w. Measured Gamma |
7 |
22.6 |
30.94 |
41.1 |
HemoSpat w. Meas Stains, Gamma |
2 |
17.72 |
31.69 |
41.57 |
HemoSpat w. Meas Stains, Gamma |
7 |
22.09 |
30.67 |
41.42 |
|
|
|
|
|
|
|
|
|
|
Tangent |
3 |
23.20 |
31.60 |
41.92 |
Tangent |
8 |
24.38 |
32.02 |
41.74 |
HemoSpat |
3 |
21.26 |
32.72 |
42.05 |
HemoSpat |
8 |
23.66 |
32.83 |
40.75 |
HemoSpat Scaled |
3 |
21.1 |
32.76 |
41.93 |
HemoSpat Scaled |
8 |
23.82 |
32.8 |
40.87 |
HemoSpat w. Measured Stains |
3 |
22.6 |
32.52 |
42.32 |
HemoSpat w. Measured Stains |
8 |
23.74 |
32.72 |
41.46 |
Tangent w. HemoSpat Stains |
3 |
22.02 |
31.60 |
41.92 |
Tangent w. HemoSpat Stains |
8 |
24.55 |
32.02 |
41.74 |
Tangent w. HemoSpat Scaled Stains |
3 |
21.89 |
31.60 |
41.92 |
Tangent w. HemoSpat Scaled Stains |
8 |
24.67 |
32.02 |
41.74 |
HemoSpat w. Measured Gamma |
3 |
22.05 |
31.73 |
42.13 |
HemoSpat w. Measured Gamma |
8 |
25.28 |
31.26 |
40.94 |
HemoSpat w. Meas Stains, Gamma |
3 |
23.43 |
31.57 |
42.44 |
HemoSpat w. Meas Stains, Gamma |
8 |
25.31 |
31.1 |
41.61 |
|
|
|
|
|
|
|
|
|
|
Tangent |
4 |
22.67 |
31.90 |
42.67 |
Tangent |
9 |
23.09 |
31.98 |
42.20 |
HemoSpat |
4 |
21.46 |
31.81 |
42.28 |
HemoSpat |
9 |
22.36 |
32.36 |
41.46 |
HemoSpat Scaled |
4 |
20.71 |
32.09 |
42.09 |
HemoSpat Scaled |
9 |
22.68 |
32.48 |
41.54 |
HemoSpat w. Measured Stains |
4 |
22.09 |
31.93 |
41.38 |
HemoSpat w. Measured Stains |
9 |
22.95 |
32.24 |
42.17 |
Tangent w. HemoSpat Stains |
4 |
21.51 |
31.90 |
42.67 |
Tangent w. HemoSpat Stains |
9 |
22.52 |
31.98 |
42.20 |
Tangent w. HemoSpat Scaled Stains |
4 |
20.88 |
31.90 |
42.67 |
Tangent w. HemoSpat Scaled Stains |
9 |
22.91 |
31.98 |
42.20 |
HemoSpat w. Measured Gamma |
4 |
21.65 |
31.5 |
42.48 |
HemoSpat w. Measured Gamma |
9 |
23.03 |
31.81 |
42.13 |
HemoSpat w. Meas Stains, Gamma |
4 |
21.85 |
31.93 |
41.57 |
HemoSpat w. Meas Stains, Gamma |
9 |
23.66 |
31.65 |
42.76 |
|
|
|
|
|
|
|
|
|
|
Tangent |
5 |
23.40 |
31.73 |
42.25 |
Tangent |
10 |
24.71 |
30.81 |
42.74 |
HemoSpat |
5 |
22.48 |
32.99 |
41.89 |
HemoSpat |
10 |
22.91 |
31.26 |
41.69 |
HemoSpat Scaled |
5 |
22.52 |
33.11 |
41.89 |
HemoSpat Scaled |
10 |
24.29 |
30.79 |
41.5 |
HemoSpat w. Measured Stains |
5 |
22.6 |
32.6 |
42.83 |
HemoSpat w. Measured Stains |
10 |
25.12 |
30.55 |
41.18 |
Tangent w. HemoSpat Stains |
5 |
23.29 |
31.73 |
42.25 |
Tangent w. HemoSpat Stains |
10 |
23.09 |
30.81 |
42.74 |
Tangent w. HemoSpat Scaled Stains |
5 |
23.52 |
31.73 |
42.25 |
Tangent w. HemoSpat Scaled Stains |
10 |
24.04 |
30.81 |
42.74 |
HemoSpat w. Measured Gamma |
5 |
23.03 |
32.24 |
42.13 |
HemoSpat w. Measured Gamma |
10 |
23.46 |
30.71 |
42.64 |
HemoSpat w. Meas Stains, Gamma |
5 |
23.43 |
31.73 |
43.07 |
HemoSpat w. Meas Stains, Gamma |
10 |
25.35 |
30.31 |
42.2 |
Table 1: displays the results of each method for the ten impact patterns
Std Deviations: Methods |
X Value (In) |
Y Value (In) |
Z Value (In) |
||||||||
Tangent |
1.85 |
0.36 |
0.51 |
||||||||
HemoSpat |
0.74 |
0.55 |
0.44 |
||||||||
HemoSpat Scaled |
1.12 |
0.62 |
0.37 |
||||||||
HemoSpat w. Measured Stains |
2.15 |
0.75 |
0.49 |
||||||||
HemoSpat w. Measured Gamma |
0.95 |
0.51 |
0.54 |
||||||||
HemoSpat w. Meas Stains, Gamma |
2.18 |
0.58 |
0.58 |
||||||||
Std Deviations: Manipulated measurements |
X Value (In) |
Y Value (In) |
Z Value (In) |
||||||||
Width + .12mm |
2.27 |
0.36 |
0.51 |
||||||||
Width -.12mm |
1.74 |
0.36 |
0.51 |
||||||||
Length +.14mm |
1.64 |
0.36 |
0.51 |
||||||||
Length -.14mm |
2.57 |
0.36 |
0.51 |
||||||||
Width+ Length- |
3.52 |
0.36 |
0.51 |
||||||||
Width- Length+ |
2.08 |
0.36 |
0.51 |
||||||||
Gamma +2.5 |
0.74 |
0.46 |
0.47 |
||||||||
Gamma -2.5 |
1.36 |
1.22 |
0.41 |
||||||||
Pattern |
# of Stains |
Net Sum: Width Differences(mm)(Measured Stains-HSS Stains) |
Net Sum: Length Differences(mm)(Measured Stains-HSS Stains) |
Absolute Avg: Width Differences(mm)(Measured Stains-HSS Stains) |
Absolute Avg: Length Differences (mm)(Measured Stains-HSS Stains) |
StdDev Width (mm) |
StdDev Length (mm) |
||||
Impact Pattern 1 |
17 |
-1.2 |
0.1 |
0.12 |
0.12 |
0.14 |
0.14 |
||||
Impact Pattern 2 |
17 |
-1.4 |
1.5 |
0.12 |
0.12 |
0.13 |
0.17 |
||||
Impact Pattern 3 |
16 |
-1.6 |
-3.2 |
0.13 |
0.13 |
0.11 |
0.15 |
||||
Impact Pattern 4 |
17 |
-1.3 |
-2.9 |
0.12 |
0.12 |
0.12 |
0.14 |
||||
Impact Pattern 5 |
19 |
-0.7 |
-0.5 |
0.11 |
0.11 |
0.20 |
0.22 |
||||
Impact Pattern 6 |
16 |
-1.1 |
-1.5 |
0.13 |
0.13 |
0.10 |
0.11 |
||||
Impact Pattern 7 |
19 |
-1.3 |
-1.7 |
0.11 |
0.11 |
0.11 |
0.19 |
||||
Impact Pattern 8 |
16 |
-0.1 |
0.4 |
0.13 |
0.13 |
0.12 |
0.18 |
||||
Impact Pattern 9 |
14 |
-0.3 |
-0.3 |
0.14 |
0.15 |
0.11 |
0.17 |
||||
Impact Pattern 10 |
12 |
-0.5 |
-0.9 |
0.17 |
0.18 |
0.14 |
0.15 |
||||
Avg Net Width Diff. |
Avg Net Length Diff. |
Avg Absolute Width Diff. |
Avg Absolute Length Diff. |
StdDev Width - All |
StdDev Width - All |
||||||
All Patterns |
163 |
-0.06 |
-0.06 |
0.12 |
0.14 |
0.13 |
0.19 |
||||
Table 2 displays the standard deviations for each methodology, the comparative differences between the Measured Stains and HemoSpat Scaled stains for each pattern, and standard deviations for width and length
HemoSpat, Tangent, Origin |
X Value (In) |
Y Value (In) |
Z Value (In) |
Avg X,Y,Z Relative Difference |
1.47 |
0.68 |
0.59 |
Avg HemoSpat Absolute Difference |
1.61 |
1.30 |
0.45 |
Avg Tangent Absolute Difference |
1.62 |
0.72 |
0.44 |
Avg HemoSpat % Absolute Deviation |
6.71 |
4.18 |
1.08 |
Avg Tangent % Absolute Deviation |
6.73 |
2.32 |
1.04 |
HemoSpat Scaled, Tangent, Origin |
X Value (In) |
Y Value (In) |
Z Value (In) |
Avg X,Y,Z Relative Difference |
1.33 |
0.56 |
0.60 |
Avg HemoSpat Absolute Difference |
1.52 |
1.28 |
0.47 |
Avg Tangent Absolute Difference |
1.62 |
0.72 |
0.44 |
Avg HemoSpat % Absolute Deviation |
6.31 |
4.13 |
1.13 |
Avg Tangent % Absolute Deviation |
6.73 |
2.32 |
1.04 |
% Relative Deviation |
6.01 |
1.71 |
1.45 |
HemoSpat Scaled, HemoSpat w. Measured Stains |
X Value (In) |
Y Value (In) |
Z Value (In) |
Avg X,Y,Z Relative Difference |
1.32 |
0.34 |
0.44 |
Avg % Relative Deviation |
5.94 |
1.04 |
1.06 |
HemoSpat, HemoSpat w. Measured Gamma |
X Value (In) |
Y Value (In) |
Z Value (In) |
Avg X,Y,Z Relative Difference |
0.67 |
0.76 |
0.26 |
Avg % Relative Deviation |
2.96 |
2.36 |
0.63 |
HemoSpat Scaled, HemoSpat w. Measured Stains, Gamma |
X Value (In) |
Y Value (In) |
Z Value (In) |
Avg X,Y,Z Relative Difference |
1.58 |
0.80 |
0.59 |
Avg % Relative Deviation |
7.06 |
2.45 |
1.41 |
HemoSpat, Gamma +2.5 |
X Value (In) |
Y Value (In) |
Z Value (In) |
Avg X,Y,Z Relative Difference |
1.58 |
1.60 |
0.07 |
Avg % Relative Deviation |
7.04 |
4.97 |
0.17 |
HemoSpat, Gamma -2.5 |
X Value (In) |
Y Value (In) |
Z Value (In) |
Avg X,Y,Z Relative Difference |
1.63 |
1.68 |
0.09 |
Avg % Relative Deviation |
7.25 |
5.24 |
0.22 |
Avg X Value Difference (In) Increased Width (+.12mm) vs. Tangent |
4.64 |
Avg X Value Difference (In) Decreased Width (-.12mm) vs. Tangent |
3.31 |
Avg % Relative Deviation |
20.59 |
Avg % Relative Deviation |
14.71 |
Avg Impact Angle Difference |
4.82 |
Avg Impact Angle Difference |
4.45 |
Avg Impact Angle % Deviation |
10.40 |
Avg Impact Angle % Deviation |
9.62 |
Avg X Value Difference (In) Increased Length (+.14mm) vs. Tangent |
2.75 |
Avg X Value Difference (In) Decreased Length (+.14mm) vs. Tangent |
4.47 |
Avg % Relative Deviation |
12.15 |
Avg % Relative Deviation |
19.73 |
Avg Impact Angle Difference |
3.58 |
Avg Impact Angle Difference |
4.44 |
Avg Impact Angle % Deviation |
7.70 |
Avg Impact Angle % Deviation |
9.55 |
Avg X Value Difference (In) Width (+), Length (+) |
0.46 |
Avg X Value Difference (In) Width (+), Length (+) |
0.51 |
Avg % Relative Deviation |
2.1 |
Avg % Relative Deviation |
2.31 |
Avg Impact Angle Difference |
0.63 |
Avg Impact Angle Difference |
0.71 |
Avg Impact Angle % Deviation |
1.39 |
Avg Impact Angle % Deviation |
1.58 |
Avg X Value Difference (In) Width (+), Length (-) |
11.82 |
Avg X Value Difference (In) Width (-), Length (+) |
5.03 |
Avg % Relative Deviation |
52.84 |
Avg % Relative Deviation |
22.39 |
Avg Impact Angle Difference |
9.39 |
Avg Impact Angle Difference |
7.48 |
Avg Impact Angle % Deviation |
20.42 |
Avg Impact Angle % Deviation |
16.11 |
Table 3: displays the Relative and Absolute Differences between the different methodologies