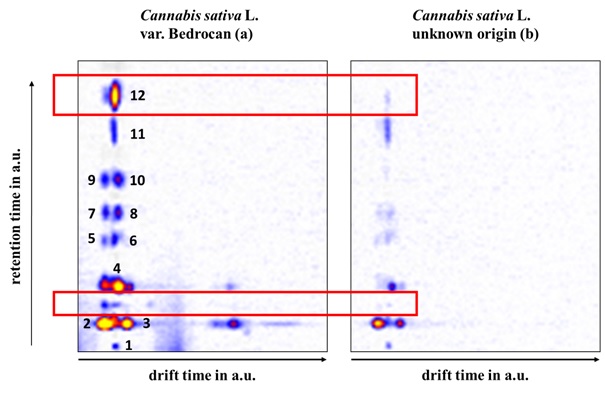
Figure 1 Pattern of Cannabis sativa L. var. Bedrocan (a) and one of unknown origin (b).The 12 signals used for detection of cannabis Consumption in breath are numbered and 2 exemplary differences are indicated by a red frame.
Figure 1 Pattern of Cannabis sativa L. var. Bedrocan (a) and one of unknown origin (b).The 12 signals used for detection of cannabis Consumption in breath are numbered and 2 exemplary differences are indicated by a red frame.
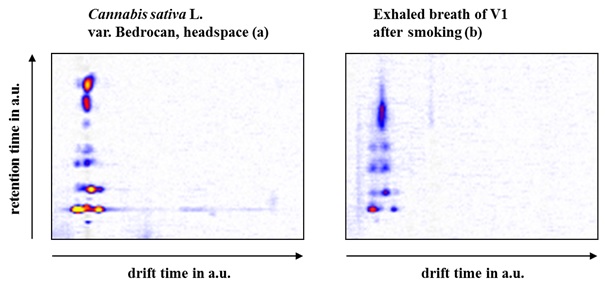
Figure 2GC-IMS signal pattern of Cannabis sativa L. var. Bedrocan: headspace of a dried sample (a) and after smoking (0.5 g) by V1 (b).
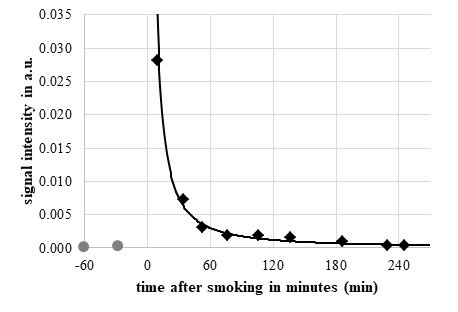
Figure 3GC-IMS signal intensity of one particular Cannabis sativa L. biomarkers (peak no. 1 as indicated in Fig. 1a) overtime before () and after smoking () (0.5g).
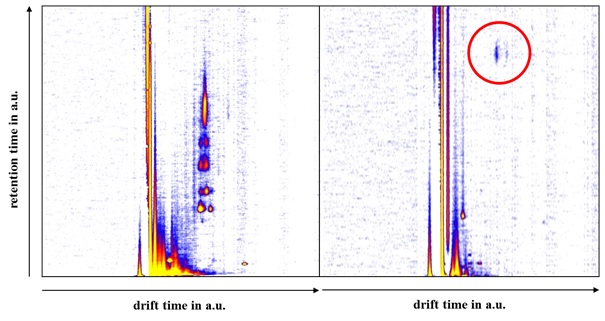
Figure 4Pattern of Cannabis sativa L. var. Bedrocanafter smoking 0.5 g (a) and after eating 1 kg of Daucus carota by V1 (b), the red circle indicates the presence of caryophyllenexpoxid.
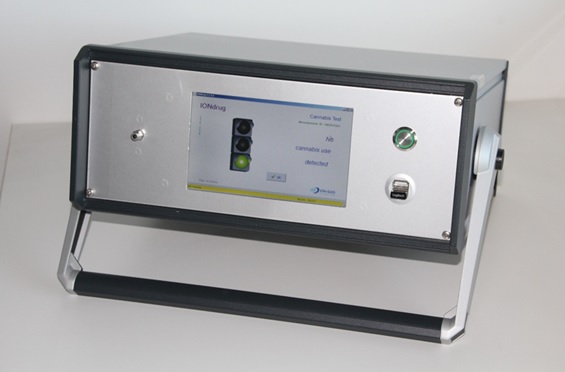
Figure 5 The mobile GC-IMS IONdrug with ~ 8kg incl. a battery for 4 h autonomous operation.
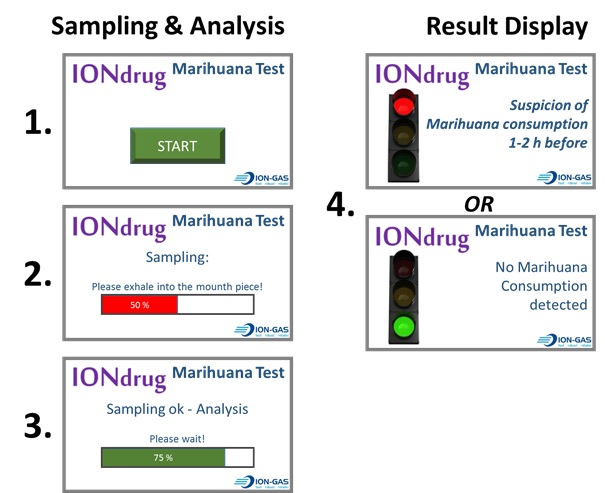
Figure 6 Exemplary screenshots of a complete run of Cannabis consumption detection in exhaled breath.
Volunteer 1 |
|||
time after cannabis consumption (min) |
THC (ng/mL) |
11-OH-THC (ng/mL) |
THC-COOH (ng/mL) |
0 |
n.d. |
n.d. |
n.d. |
26 |
8,0 |
0,33 |
4,3 |
36 |
6,1 |
0,37 |
4,7 |
46 |
5,1 |
0,34 |
4,1 |
56 |
4,4 |
0,36 |
3,6 |
66 |
4,7 |
0,42 |
3,6 |
106 |
3,4 |
0,40 |
3,2 |
136 |
1,9 |
0,32 |
3,3 |
316 |
0,30 |
n.d. |
2,6 |
406 |
n.d. |
n.d. |
n.d. |
Table 1 Concentrations in a toxicokinetic blood profile of 2 volunteers recorded by GC-MS.