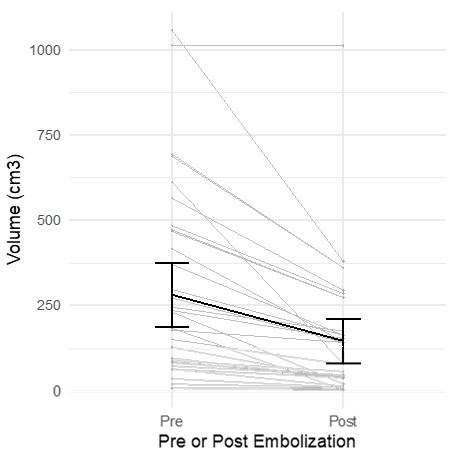
Figure 1: Individual change (grey) and mean change (black) in fibroid volume before and after embolization
Figure 1: Individual change (grey) and mean change (black) in fibroid volume before and after embolization
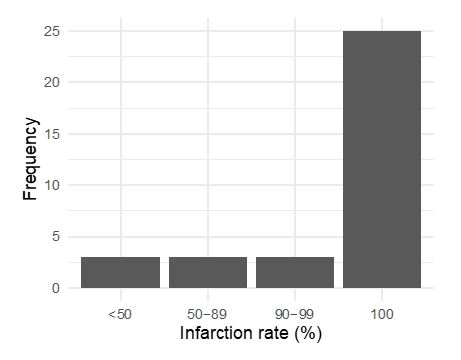
Figure 2: Number of patients with particular infarction rate (N=34, Median = 100, Interquartile range = 50 to 100)
Tables at a glance
Figures at a glance