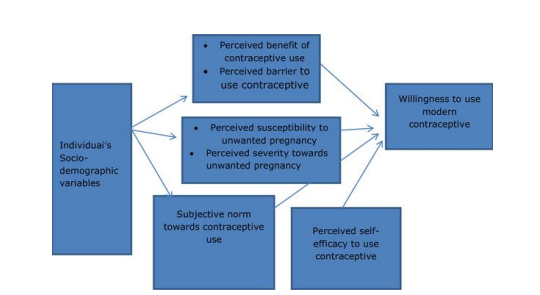
Figure 1: Theoretical framework for willingness to use modern contraceptive according to Kahsay et al., 2018
Figure 1: Theoretical framework for willingness to use modern contraceptive according to Kahsay et al., 2018
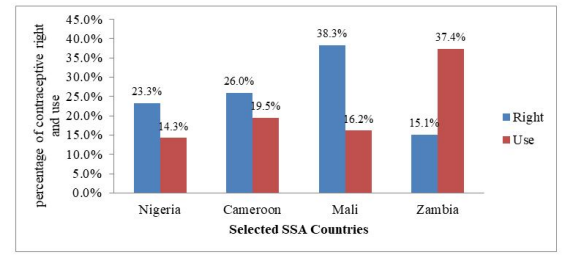
Figure 2: Showing the level of Contraceptive Right and Use in Selected Countries
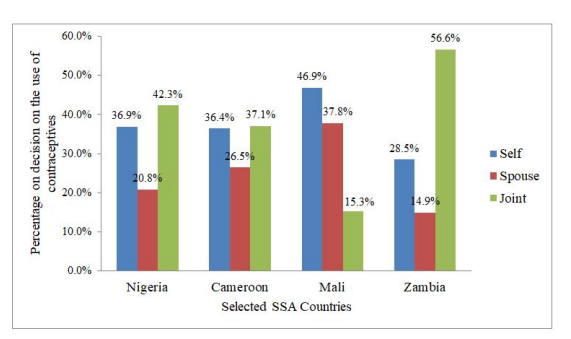
Figure 3: Showing the Decision on not Using Contraceptives in Selected Countries
Tables at a glance
Figures at a glance