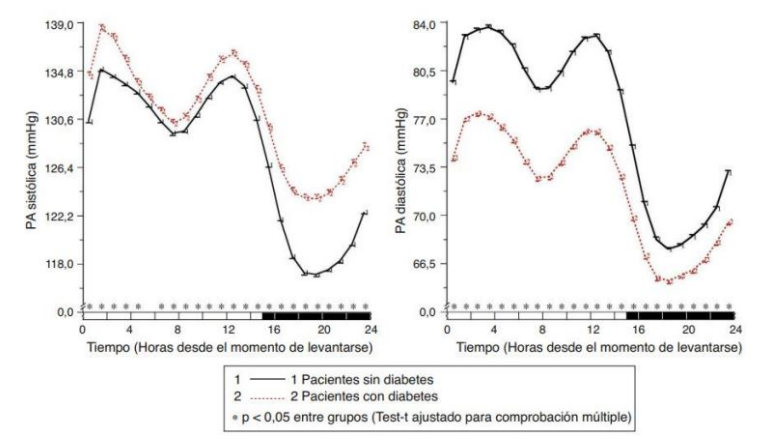
Figure 1: Circadian Pattern of SBP (left) and DBP (right) in hypertensive patients without (solid line) and with diabetes (dashed line) assessed through 48-hour ambulatory blood pressure monitoring. The shaded bar on the horizontal axis of the graphs indicates the average nighttime hours of patient sleep
Tables at a glance
Figures at a glance