Type-2 Diabetes Prediction using Machine Learning Algorithms and Ensembles with Hyperparameters
Received Date: March 01, 2024 Accepted Date: April 02, 2024 Published Date: April 05, 2024
doi: 10.17303/jmdd.2024.2.105
Citation: Kunal Verma, Dr. Pon Harshavardhanan (2024) Type-2 Diabetes Prediction using Machine Learning Algorithms and Ensembles with Hyperparameters. J Metab Disord Diabetes 2: 1-11
Abstract
Diabetes, a complicated metabolic sickness characterized with the aid of chronic hyperglycemia (high Blood Sugar), is rising as one of the main health concerns of the 21st century. The superiority of diabetes international has reached unparalleled tiers, affecting over 463 million individuals as of 2019, in keeping with the Global Diabetes Federation. This number is predicted to rise to 700 million by 2045, reflecting an alarming upward trend. Diabetes is a chief contributor to morbidity and mortality. It’s miles answerable for approximately 4.2 million deaths every year, making it one of the pinnacle ten leading reasons of demise globally.
The present article suggests a hybrid prediction model to aid in type 2 diabetes diagnoses. This study uses the Vanderbilt biostatistical Diabetes data set as a reference to determine the efficacy of various ML (Machine Learning) methods and strategies applied to diabetes forecasting. In this paper, we have combined ensembles such as AdaBoost, Light GBM, Cat Boost, Gradient Boost, and ML algorithms like RF (Random Forest), DT (Decision Tree), SVM (Support Vector Machine), and LR (Logistic Regression). Then, to enhance the models’ accuracy, we employed HyperParameters like Grid search CV and Randomized search CV. Following their comparative analysis, the optimal model for diabetes prediction was selected. The best model is Cat Boost with a Randomized Search CV with an accuracy of 95.7 percent.
Keywords: Machine Learning Algorithm; Ensembles; HyperParameters; Support Vector Machine; Random Forest; Logistic Regression and Decision Tree; AdaBoost; LightGBM; Cat Boost and Gradient Boost; Grid Search CV and Randomized CV
Background
There are mainly 3 forms of diabetes. T1D (Type 1 diabetes), T2D (Type 2 Diabetes) and gestational diabetes.
Type 1 diabetes mellitusAn autoimmune reaction that results in the body accidentally attacking and destroying the insulin-producing beta cells in the pancreas is the cause of this diabetes. This leads to the stop of insulin production.
Type 1 diabetesDiabetes is produced by the body becoming immune to the effects of insulin, which prevents the pancreas from producing enough insulin to prevent blood sugar levels from increasing.
Gestational diabetesThis diabetes is caused by the action of hormones that block insulin during pregnancy. The most common diabetes is type 2 diabetes. About 80- 90percent of people suffer from type 2 diabetes, and the number of cases is increasing significantly in all countries. Therefore, in this article, we focused on type 2 diabetes estimation and tested the performance of our ML models. To obtain this objective, the present study investigated diabetes prediction using various methods of diabetes-related attributes. For this purpose, we use diabetes datasets from the Vanderbilt bio-statistical Diabetes Collection. This data is provided with the kind permission of Dr. John Schorling, Dept. of Medicine, “University of Virginia School of Medicine”. We applied several ML classification and ensemble approaches to estimate diabetes. ML is an approach applied to explicitly train machines or computers. Various ML approaches ensure effective knowledge collection by creating various models and classification sets based on the collected data set.
Literature ReviewIn previous diabetes research, many researchers have conducted numerous studies on different diabetes data sets. However, the ultimate goal is to find the best prediction model.
[1] Discussed the diabetes prediction models based on data mining. They used the dataset provided by Dr. Schroling and got 90 percent accuracy of their model used by K-fold and Kappa Statistics. For Random Forest they got an accuracy of 79 percent and for logistic Regression, They got an accuracy of 72 percent.
They have also collected data from online questionnaires. Using the Weka toolkit they tested the proposed model and got an accuracy of 93percent. For RF they obtain an accuracy of 89 percent and for LR, they obtain an accuracy of 85 percent In [2], this author used three classification algorithms on the Indian Diabetes Dataset of PIMA. SVM which has an accuracy of 65 percent. Naive Bayes which has accuracy of 76 percent and Decision Tree which has an accuracy of 73 percent.
In [3], the author used ensembles learning model for diabetes prediction, the author has reported 79 percent accuracy using Gradient Boost, 78 percent accuracy using Random Forest, and 74 percent accuracy using Decision Tree.
[4], have collected the data from Al sukari Hospital for developing the ML model. The author has reported 81percent accuracy for logistic regression, 78 percent accuracy for Random Forest, and 76 percent accuracy for KNN.
[5], the author utilized ML methods for the classification such as Logistic regression (Accuracy of 84.8), KNN (Accuracy 84), CART (Accuracy 85.7), Random Forest (Accuracy 88.1), SVM (Accuracy 85.3) and Light GBM (Accuracy 88). After Hyper-Parameter Tuning reported 90 percent accuracy of Light GBM.
Methodology
Dataset DescriptionVanderbilt Department of Biostatistics et al. (a) The diabetes data set comes from Vanderbilt Biostatistics data sets. This comes from the University of Virginia School of Medicine’s Department of Medicine and is provided by Dr. John Schorling. Then this dataset is preprocessed and some unwanted features are removed to increase the novelty of the dataset. Which is also published on data. world. Interviewed as part of a research to comprehend the incidence of diabetes, obesity, as well as risk factors of cardiovascular in African Americans in central Virginia. As per Dr. John Hong, “Mellitus type II diabetes” (adult-onset diabetes) is closely linked to obesity. A ratio of waist-to-hip can be an indicator of heart disease and diabetes. MD et al. This diabetes dataset contains information on 390 patients with 16 variables (Features).
Data PreprocessingThis step is very important in the process of ML pipeline and data analysis. If the dataset contains unwanted columns, missing values, and categorical values, it may result in low accuracy of our model. The classifier’s performance and accuracy are impacted by missing values and outliers in the original data set, which produces inaccurate and inconsistent output results. Therefore, it’s crucial to replace and move missing values when there is an outlier. During the development of the models, we converted the categorical data set into numerical data. We substituted 0 for females and 1 for males.
CorrelationCorrelation is the most common and important technique researchers help determine the degree of relationship between two or more variables from a data set. This relationship shows that variables correlate positively or negatively with each other. If the correlation value is positive, they are positively correlated; if the value is negative, they are negatively correlated. This technique produces results even when there is no relationship. We used Pearson correlation. The correlation values are range between -1 to 1.
Feature SelectionFeature in the data set simply refers to the columns. When we get the data set not all the columns or The output feature or variable need to be impacted by the features. So the features that don’t have much impact we remove them and select the important features only.
Filter MethodUsing this strategy, we only choose and filter the appropriate feature subset. After the characteristics are chosen, this mode is constructed. The correlation matrix, which is most frequently created using Pearson correlation, is used for this filtering
Wrapper MethodThis approach requires a single machine learning algorithm, and its performance is assessed. The chosen machine learning method is then fed the features, and we add or delete features based on how well the model performs.
Embbeded MethodThese techniques combine the best features of wrapper and filter approaches. In a way, this process is iterative. It handles every iteration of the model training process and meticulously identifies the elements that are most important for that iteration’s training.
ML Models
DTIt is a supervised learning technique and therefore could be applied for regression and classification issues. You use an if then-else question based on an input function to conclude. Calculate classification without having to perform multiple calculations. The decision tree can handle continuous and categorical variables.
Entropy: Essentially determines the impurity in a data set. Quantifies the uncertainty related to the distribution of class labels at a given node.
Gini Index: Also measures impurity during classification and regression trees (CART). It lies between 0 and 1, where 0 means that all observations belong to a class and 1 is a random distribution of elements within the classes.
Information Gain: It measures how much a specific attribute reduces the impurity of a data set when used as a split. It is calculated as the difference between the impurity of the original dataset (before splitting) and the weighted average impurity of the child nodes (after splitting).
RFThis classifier enhances the prediction accuracy of a given data set by utilizing numerous DTs on various subsets and averaging the results. Decision trees that tend to overfit their training set are corrected by random forests. It is trained using the “bagging” method. The more trees there are in the forest, the higher the accuracy.
The random forest depends on these Hyperparameters n-estimators: The number of trees generated by the algorithm before the prediction average.
max-features: The maximum number of features considered for splitting a node.
mini-sample-leaf: Indicates how many leaves are needed in minimum for an internal node to divide.
Criterion: It determines How to split a node in every tree. (Gini impurity/entropy/ logarithmic loss)
max-leaf-nodes: Maximum number of leaf nodes in each tree.
LRIt is a supervised ML algorithm primarily applied for classification tasks that aim to estimate the probability of whether an instance is related to a specific class or not. To estimate whether a patient has diabetes (1) or not (0), logistic regression is used as a disease classification.
Sigmoid function: Used to map predicted values into probabilities. So the value remains between 0 and 1. A curve is created that looks like an “S” formation.
SVMIt’s a supervised learning method that works with regression as well as classification. In SVM, we build a more effective boundary or decision line that could split the n-dimensional space into classes, making it simple to categorize new data points into suitable categories in the future. We refer to this optimal dimension as a hyperplane.
Kernel: It takes a low-dimensional input space and converts it to a high-dimensional input space. In our analysis, we utilized three types of Kernel
Linear Kernel: It Creates a linear decision boundary, which is appropriate when the data can be separated by a straight line.
Radial Function Kernel (“rbf”): Enables SVM to recognize complex patterns in data. It can be used in linear and nonlinear data.
Polynomial Kernel (”poly”): This is used when the data has a polynomial relationship. To control the order of the polynomial, we can set it using the Degree parameter.
Ensembles Ada BoostAdaptive boosting combines the estimations of many weak learners, which are usually DT, to create a stronger learner. During the training period, n DT is created. Priority is given to the misclassified data in the first model during the construction of the first tree, and these records are then used as input in the second model. This procedure starts when we indicate how many basic learners we want to produce.
Gradient BoostIn GB the mean of the relevant column will be returned by the gradient boosting algorithm’s first weak learner, which won’t be trained on the data set. Next, the O/P or target column for the next weak learning algorithm to be trained will be determined by taking the residual from the O/P of the 1st weak learner algorithm. The loss function that is used to create the residuals in the gradient boosting dataset must always be different, and the data must be either numerical or categorical.
Cat BoostThere are two key features. It makes use of gradient boosting and operates on categorical data. Using a variety of statistics on combinations of categorical qualities and combinations of categorical together with numerical features, Cat Boost turns categorical values into numbers. Cat Boost uses symmetric trees, every decision node uses the same split condition at every department level.
Light GBMBecause it is based on DT methods, instead of dividing the tree based on depth or level like other boosting algorithms, it splits the tree leaf-wise according to its best fit. As a consequence, in Light GBM, the leaf-wise approach may minimize more loss than the level-wise strategy while developing on the same leaf, producing noticeably better accuracy that is seldom possible with any of the boosting approaches now in use. It is also unexpectedly quick, which is why it is called ”light.”
Hyperparameters
Grid Search CVDuring grid search Performing hyperparameter optimization, we must define a parameter space, also known as a parameter grid, in which we include a variety of potential hyperparameter values that we may utilize in the model’s construction. The grid search approach is used to arrange these hyperparameters into a matrix-like structure. After that, all feasible combinations of hyper-parameter values are applied to train the model. Next, the model that performs the best is chosen.
Randomized Search CVIt only looks for a predetermined number of hyperparameter settings in this. To determine the optimal set of hyperparameters, it randomly navigates around the grid. This method cuts down on pointless computation. It requires the value distribution. However, it did not ensure the optimal combinations of parameters.
Result and Discussion
We evaluated our model in terms of recall, precision, F-1 score as well as support. We also compared the accuracy of our model with some published work. Like the PIMA Indian Diabetes data set.
After Preprocessing of data, we are left with the details of 390 Patients and 16 Variables. The patient without an A1c hemoglobin level was not included in this. They were diagnosed with diabetes = yes if their hemoglobin A1c was 6.5 or above
In the decision tree, we achieved 94 percent accuracy using a Randomized Search CV. In logistic regression, the accuracy is the same throughout Randomized Search CV and with Grid Search CV. That’s 94 percent. Wu et al. (2018) In other pub- lished works, the best model accuracy is 90 percent. Our best model is CatBoost with a Randomized Search CV. This gives an accuracy of 95.7%.
[11] In contrast, the other study also used the PIMA data set, which provided the highest Random Forest Tree accuracy of 77.48%.
Conclusion and Future Work
Diabetes is among the most significant Real World Medical Problems. This disorder carries a widespread risk of complications, which includes cardiovascular sickness, kidney failure, blindness, and lower-limb amputations, which lessen the great of lifestyles for thousands and thousands. The impact of diabetes isn’t always restricted to excessive-income nations, low and middle-earnings international locations also are experiencing a rising burden.
In this study, a structured approach is taken to create a model that predicts diabetes with a combination of ML methods, ensembles, and hyperparameters. With an accuracy of 95.7%, Cat Boost with Randomized Search CV was the best model combination. For ongoing training and optimization of our suggested model, real and recent hospital patient data must be incorporated into future work. If there is an app that allows users to track their past di-diabetes records, that will be useful. Not just diabetes but also other illnesses. They can monitor their health and receive recommendations from this app. Large data sets a will enable further research to be conducted using the medical data that will be saved in a database.
- Wu H, Yang S, Huang Z, He J, Wang X, (2018) Type 2 diabetes mellitus prediction model based on data mining”. Journal Informatics in Medicine Unlocked, 10: 100-7.
- Sisodiaa D, (2018) Dilip Singh Sisodiab, “Prediction of Diabetes using Classification Algorithms. Procedia Computer Science 132, 1578–1585.
- Priya BK, Tanniru VAK, Katamaneni M, (2023) Ensemble Learning Model for Diabetes Prediction. International Conference on Innovative Data Communication Technologies and Application (ICIDCA-2023).
- Abaker AA, Saeed FA, (2021) A Comparative Analysis of Machine Learning Algorithms to Build a Predictive Model for Detecting Diabetes Complications. Informatica, 45: 117-25.
- Daniel E, Victor UA, Sibby SA, Johnson J, Aditya GV, et al. (2023) An Efficient Diabetes Prediction Model Using Ma- chine Learning. Conference on Electronics and Sustainable Communication Systems (ICESC-2023).
- Sarwar MA, Kamal N, Hamid W, Shah MA, (2018) Prediction of Diabetes Using Machine Learning Algorithms in Healthcare, in Proceedings of the 24th International Conference on Automation and Computing, 6-7.
- Soni M, Sunita D, Varma (2020) Diabetes Prediction using Machine Learning Techniques”. International Journal of Engineering Research and Technology, 9: 2278-0181.
- Daanouni O, Cherradi B, A Tmiri, (2020) “Diabetes Disease Prediction Using Supervised Machine Learning and Neighborhood Components Analysis”.
- LJ Muhammad, EA Algehyne, SS Usman, (2020) Predictive Supervised Machine Learning Models for Diabetes Mellitus. SN Computer Science.
- Xu Z, Wang Z, (2019) A Risk Prediction Model for Type 2 Diabetes Based on Weighted Feature Selection of Random Forest and XG Boost Ensemble Classifier, in The Eleventh International Conference on Advanced Computational Intelligence, Guilin China.
- Kumari S, Kumar D, Mittal M, (2021) An ensemble approach for classification and prediction of diabetes mellitus using soft voting classifier”. International Journal of Cognitive Computing in Engineering, 2: 40-6.
- Aboelfotoh MH, Martin P, Martin P, (2014) A mobile- based architecture for integrating personal health record data, in International Conference on e-Health Networking, Applications, and Services (Healthcom).
- Chhabra G, Vashisht V, Ranjan J, (2017) A Comparison of Multiple Imputation Methods for Data with Missing Values. Indian Journal of Science and Technology.
- kumar Dewangan A, Agrawal P, (2015) Classification of Diabetes Mellitus Using Machine Learning Techniques. Inter- national Journal of Engineering and Applied Sciences (IJEAS).
- Kumari VA, R Chitra, (2013) Classification of Diabetes Disease Using Support Vector Machine. International Journal of Engineering Research and Applications.
- MD RH, et al. Data Set. URL: https://data.world/informatics-edu/diabetes-prediction.
- Nabi M, Wahid A, Kumar P, (2017) Performance Analysis of Classification Algorithms in Predicting Diabetes. International Journal of Advanced Research in Computer Science
- Sonar P, Prof. K Jaya Malini, (2019) “Diabetes Prediction Using Different Machine Learning Approaches”, Computing Methodologies and Communication(ICCMC2019).
FIGURE 1
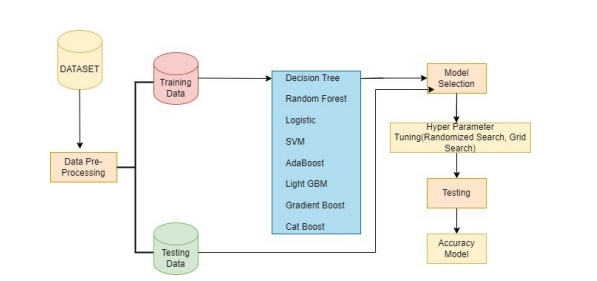
Figure 1: Proposed Methodology
FIGURE 2
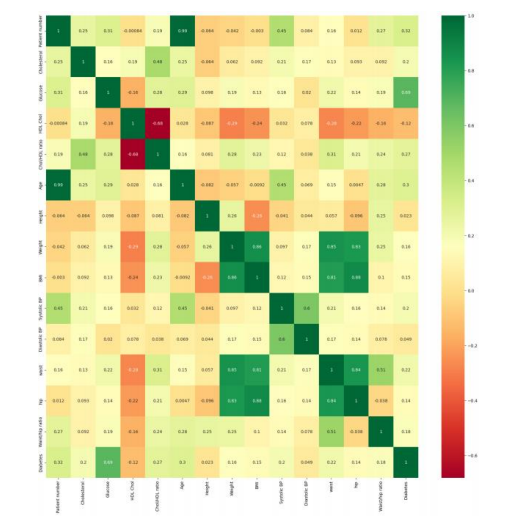
Figure 2: Correlation Between Features
FIGURE 3
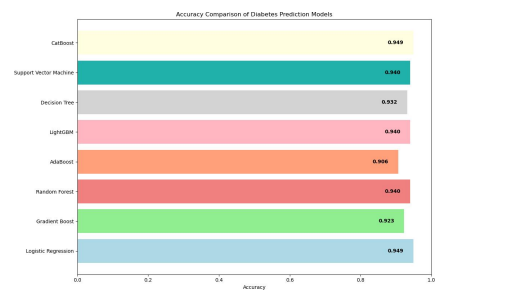
Figure 3: Accuracy Table
FIGURE 4
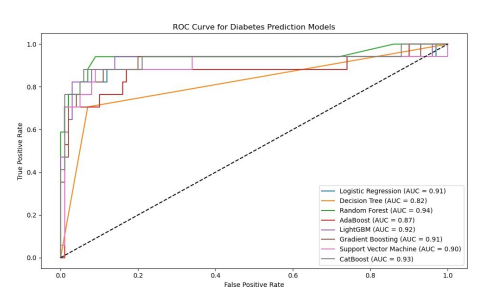
Figure 4: Roc Curve
FIGURE 5
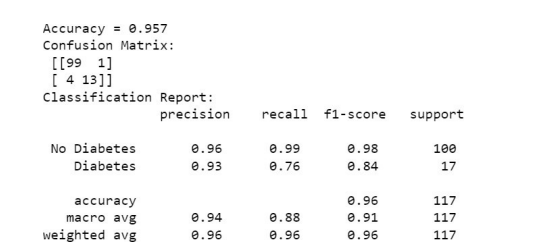
Figure 5: Cat Boost with Randomized Search CV
Tables at a glance
Figures at a glance