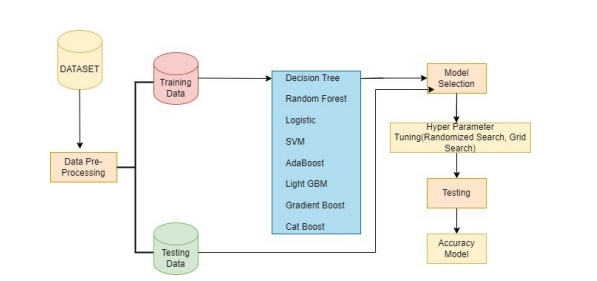
Figure 1: Proposed Methodology
Figure 1: Proposed Methodology
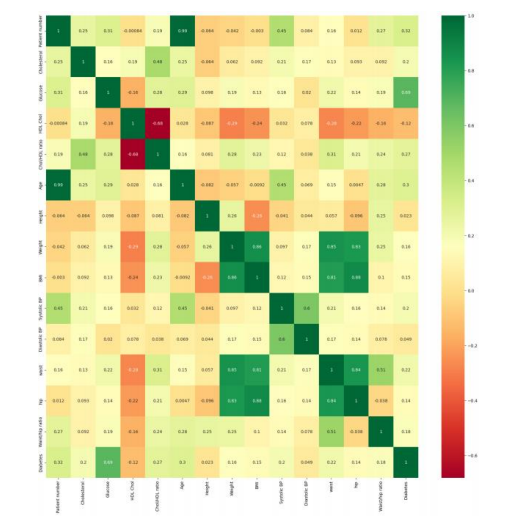
Figure 2: Correlation Between Features
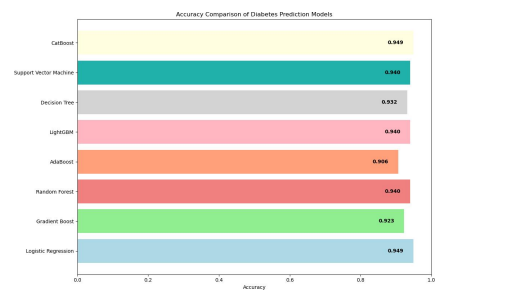
Figure 3: Accuracy Table
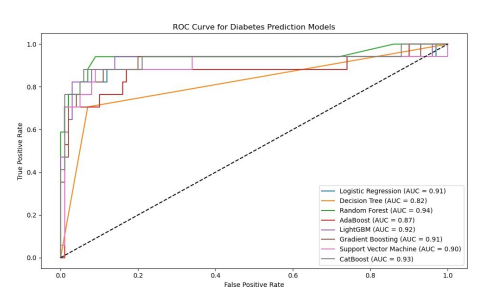
Figure 4: Roc Curve
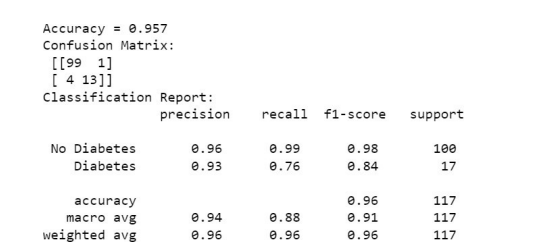
Figure 5: Cat Boost with Randomized Search CV
Tables at a glance
Figures at a glance