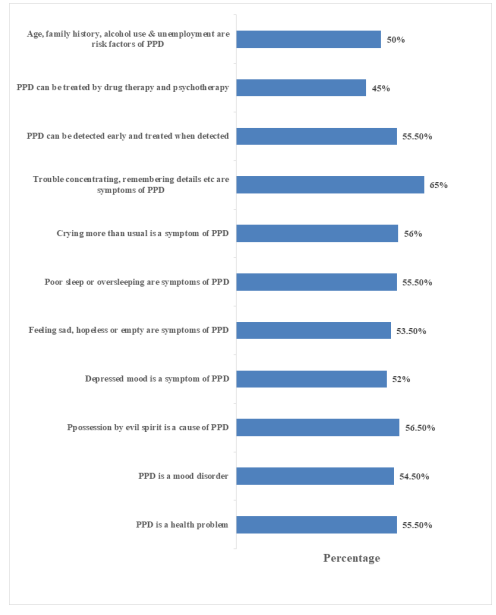
Figure 1: Knowledge of Post-Partum Depression among respondents
Figure 1: Knowledge of Post-Partum Depression among respondents
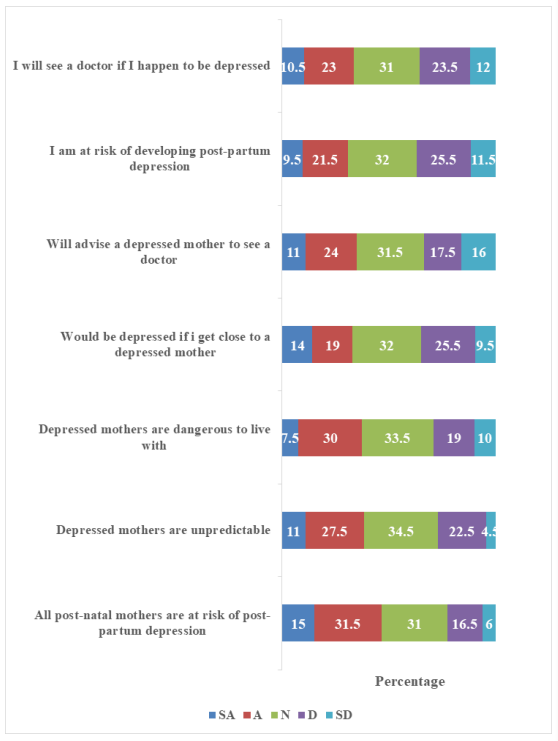
Figure 2: Attitude towards of Post-Partum Depression among respondents
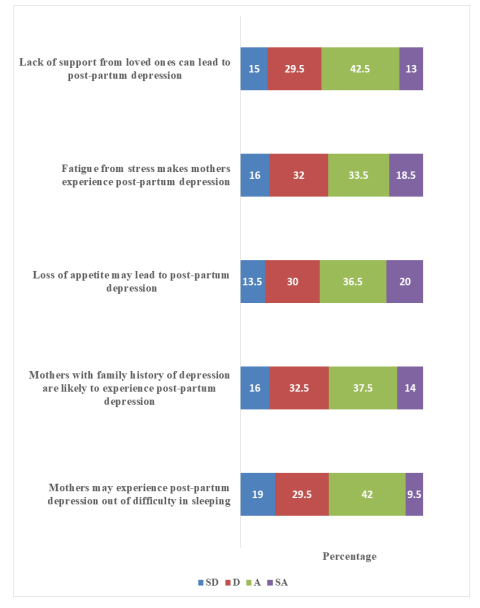
Figure 3: Risk Factors for Post-Partum Depression among respondents
Tables at a glance
Figures at a glance