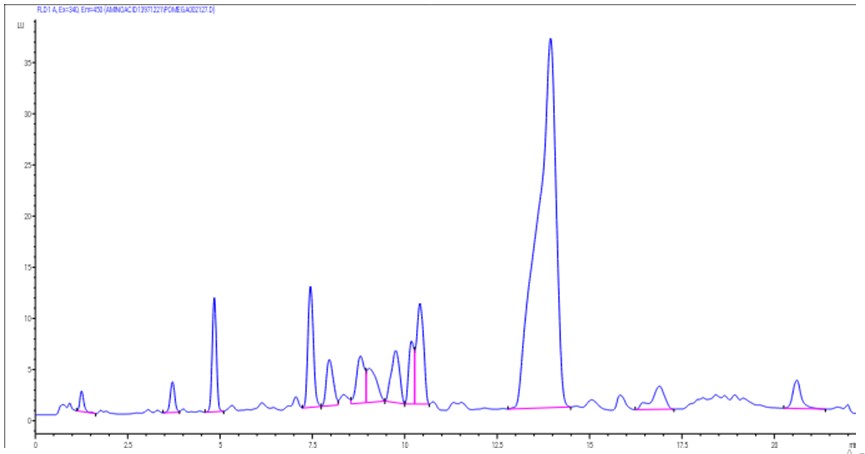
Figure 1: Chromatogram analysis of the ethanolic extract from P. granatum seed using HPLC/MS
Figure 1: Chromatogram analysis of the ethanolic extract from P. granatum seed using HPLC/MS
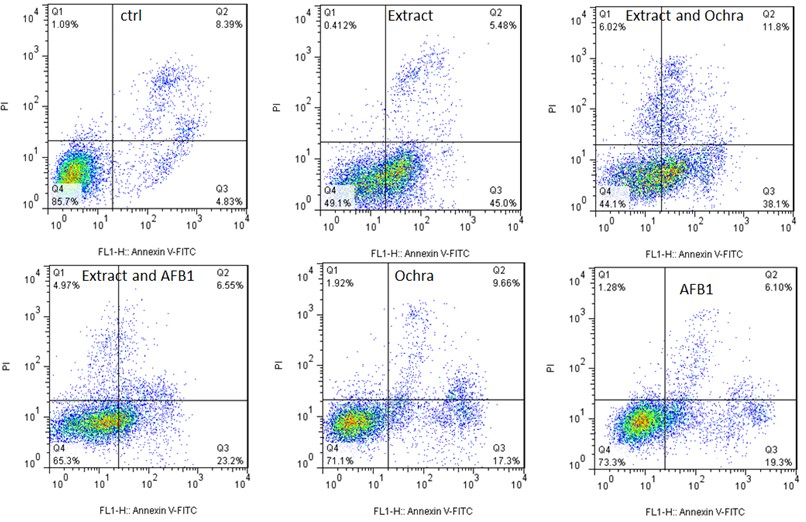
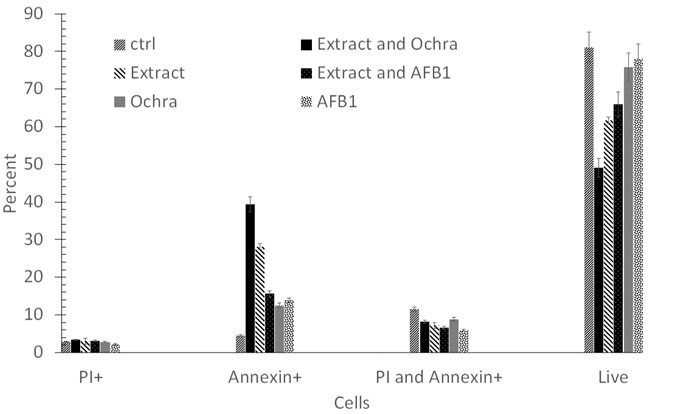
Figure 2: Induction of necrosis and apoptosis in A549 human lung adenocarcinoma cell line using various treatments. (A) A549 cells were exposed to P. granatum extract, extract and Ochra, extract and AFB1, Ochra, and AFB1 at designated doses for 24 hours. (B) The necrosis, early, and late apoptosis rates were statistically treated. Data were expressed as mean±SD. (P < 0.05, compared to control). Ochra: Ochratoxin A; AFB1: Aflatoxin B1; ctrl: Control
Tables at a glance
Figures at a glance