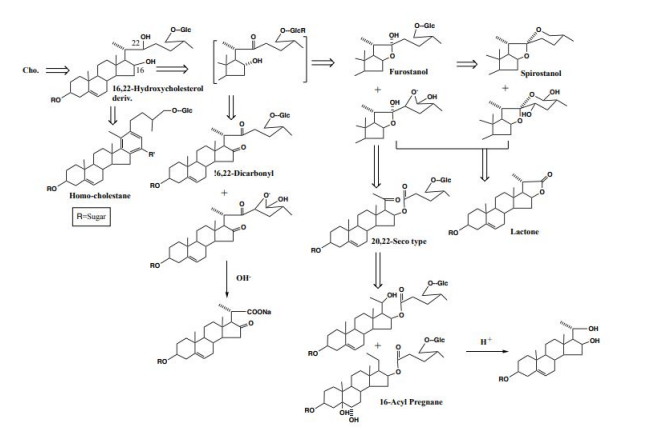
Figure 1: Obtained Steroidal Glycosides from Solanum Pplants and Their Biogenesis
Figure 1: Obtained Steroidal Glycosides from Solanum Pplants and Their Biogenesis
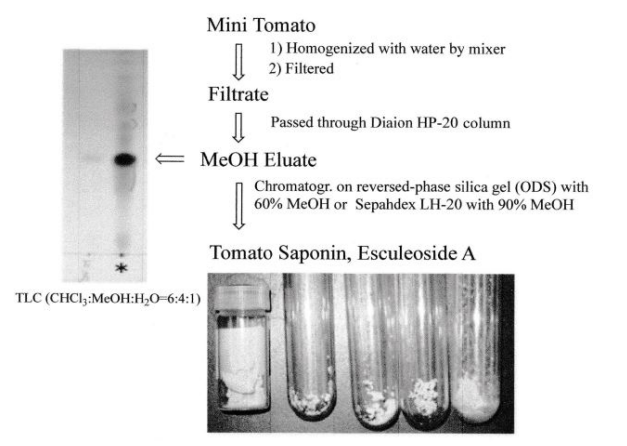
Figure 2: TLC and Crystals of Esculeoside A (1)
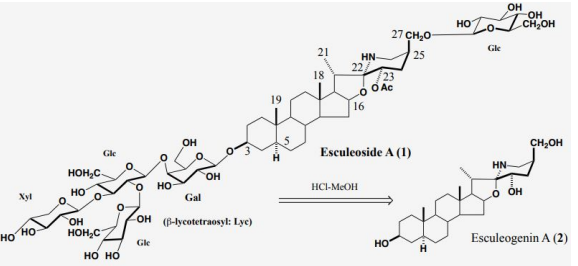
Figure 3: Structures of Esculeoside A (1) and Its Sapogenol, Esculeogenin A (2)
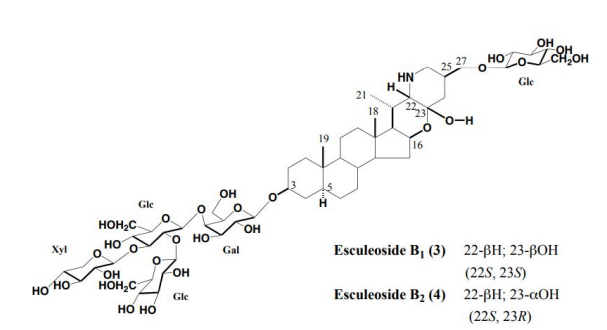
Figure 4: Structures of Esculeosides B1(3) and B2 (4)
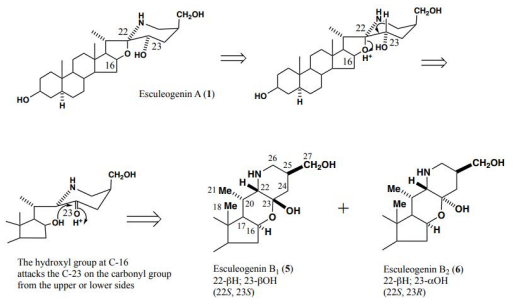
Figure 5: Conversion of Esculeogenin A (2) into Esculeogenins B1 (5) and B2(6)
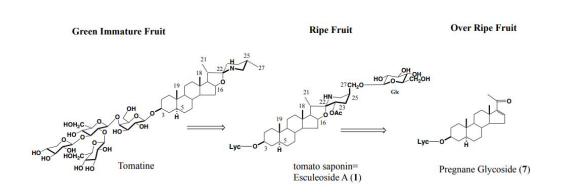
Figure 6: Seasonal Variation of Tomato Saponin
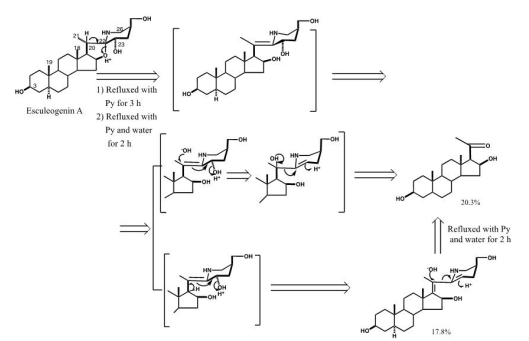
Figure 7: Facile Conversion of Esculeogenin A (2) into Pregnane
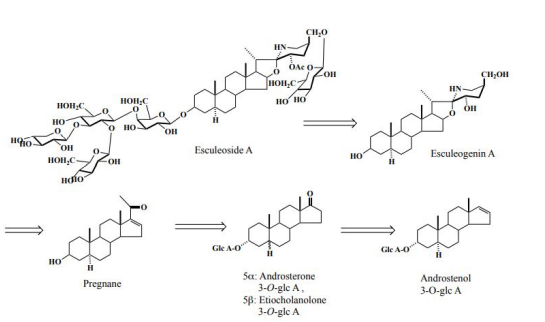
Figure 8: Internal Metabolism of Esculeoside A (1)

Figure 9: Anti-arteriosclerosis Experimental Method
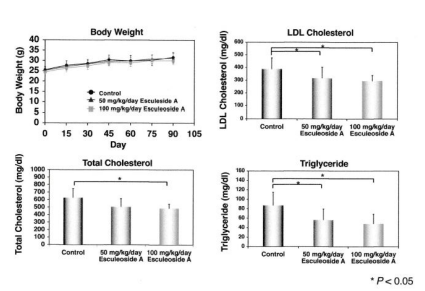
Figure 10: Anti-arteriosclerosis Effect (i) Biochemical Findings
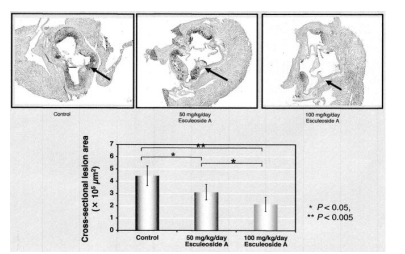
Figure 11: Anti-arteriosclerosis Effect (ii) Anatomical Findings
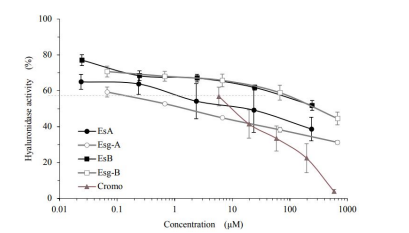
Figure 12: Inhibition of Hyaluronidase Activity by Es A/Esg-A/Es B/Esg-B/Cromo with a Modified Morgan-Elson Method.
The grey dash line shows 50% inhibition on hyaluronidase activity. Each value was the average of triplicates, and each bar indicates the mean ± SEM (n=5). Es A, Esculeoside A; Esg A, Esculeogenin A; Es B, Esculeoside B; Esg B, Esculeogenin B; Cromo,
cromoglycate.
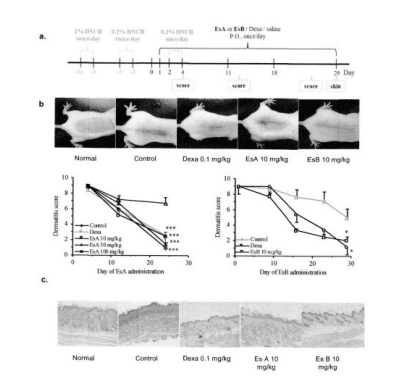
Figure 13: Oral administration of Es A or Es B on the Amelioration of Experimental Dermatitis in DNCB-treated Mice for the Care and Use of Laboratory Animals. The mice were divided into 6 (Es A) or 3 (Es B) groups. Saline application was as the normal. Saline administration after atopic dermatitis induction was as the control. Dexa (0.1 mg/kg) and Es A (10, 50 and 100 mg/kg) or Es B (10 mg/kg) administration after atopic dermatitis induction were as the treatment groups. b. Macroscopic photograph after 4 weeks oral administration. Dermatitis scores were assessed macroscopically in a blinded fashion during a 4- week period. c. Histopathological findings of mice dorsal skin were at 4-week after various application following atopic dermatitis induction. H&E staining, ×100. The results were expressed as means ± SEM. (n=3~6). *: P < 0.05, ***: P < 0.001, significantly different from the Control. Es A, Esculeoside A; Es B, Esculeoside B; Dexa, dexamethasone.
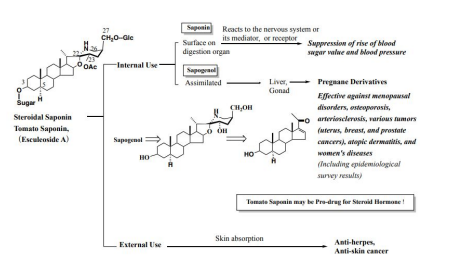
Figure 14: Effectiveness of Steroid Glycosides such as Tomato Saponin (Esculeoside A)
Figures at a glance