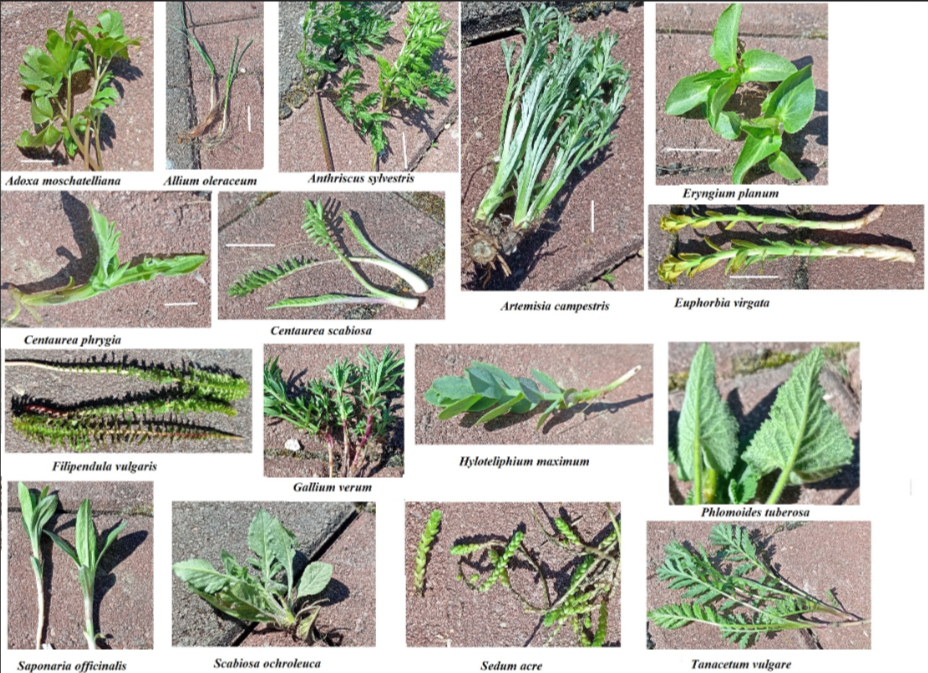
Figure 1: Common views of some studied plants with blue color in April of 2024 just after the snow missed
Figure 1: Common views of some studied plants with blue color in April of 2024 just after the snow missed
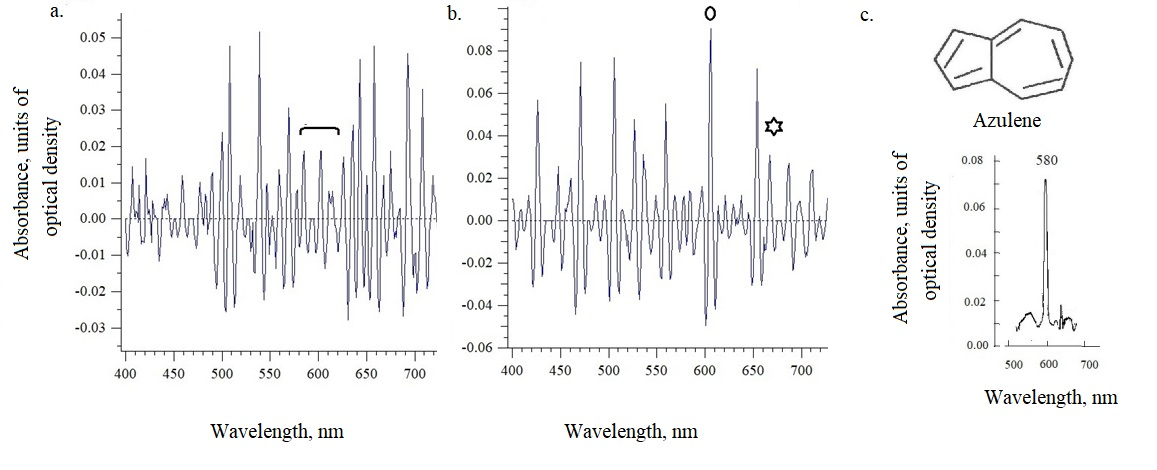
Figure 2: The absorbance spectra of the surface of the leaf of musk weed Adoxa moschtellina in April (the first derivative of curves to identify maxima). The area of azulenes without noticeable maxima is highlighted with a parenthesis (a - upper side of leaf). The recorded maxima of azulenes are marked with circles, and the maximum of chlorophyll is shown with asterisks (b - lower side of leaf). The absorption spectra (a, b) were compared with the spectrum of a blue crystal (c) of artificially synthesized azulene (“Fluka”, Germany).
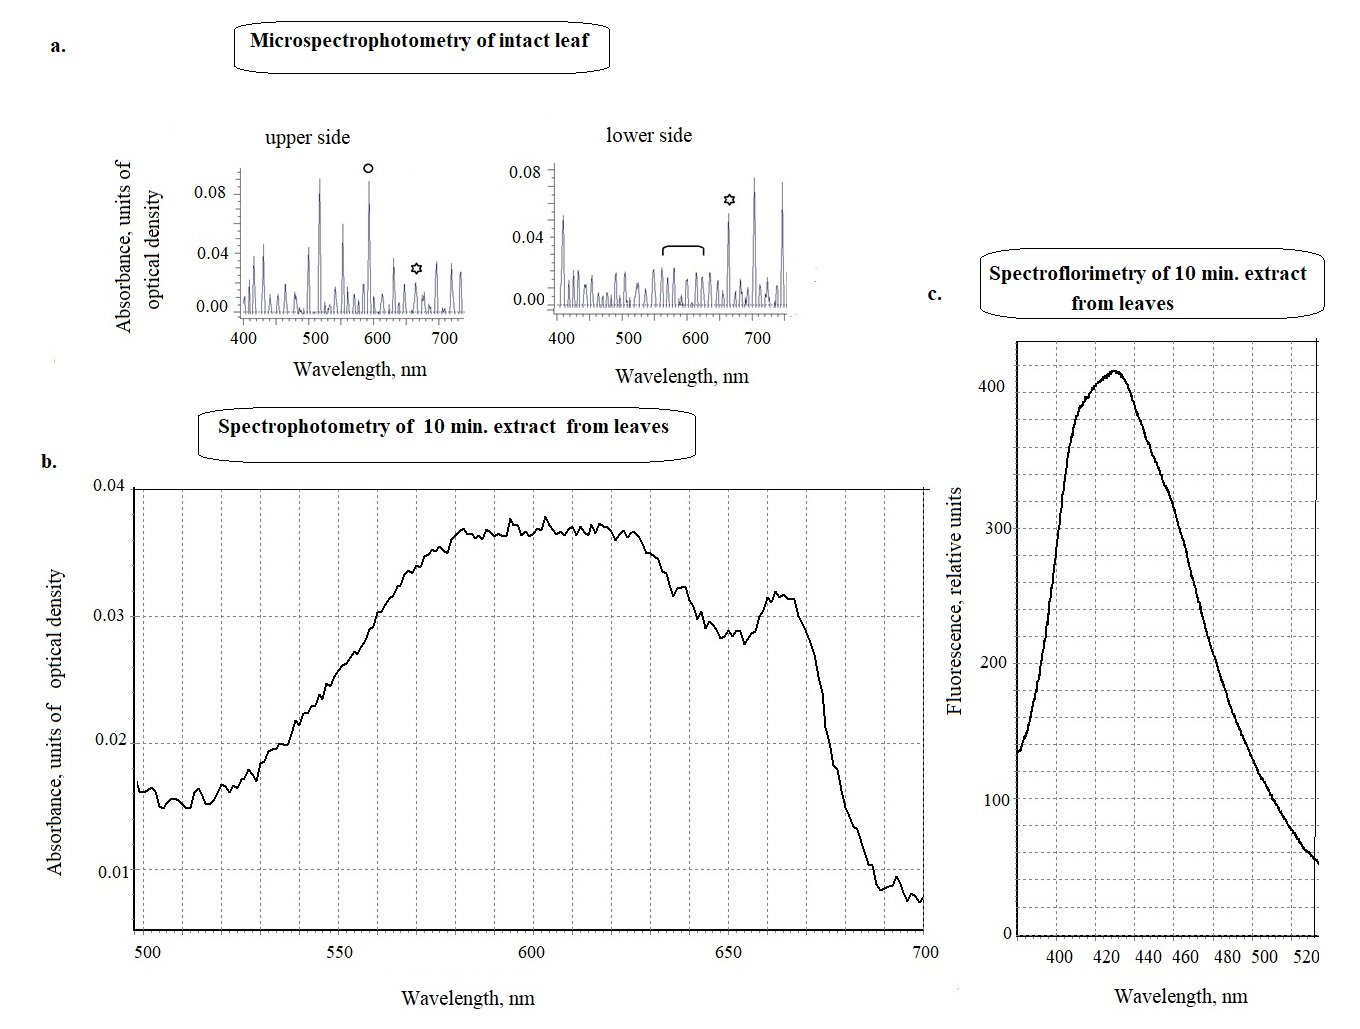
Figure 3: Spectral analysis of the leaves of Centaurea phrygia in May. (a) The absorbance spectra (the first derivative of the curves for detecting maxima) in May. The maxima of azulenes are marked with circles, and the maximum of chlorophyll is marked with asterisks. The azulene region without noticeable maxima is highlighted by a parenthesis; (b) and (c) – The absorbance and fluorescence spectra of 10 minute extracts with ethanol (leaf weight/volume 1 :10).
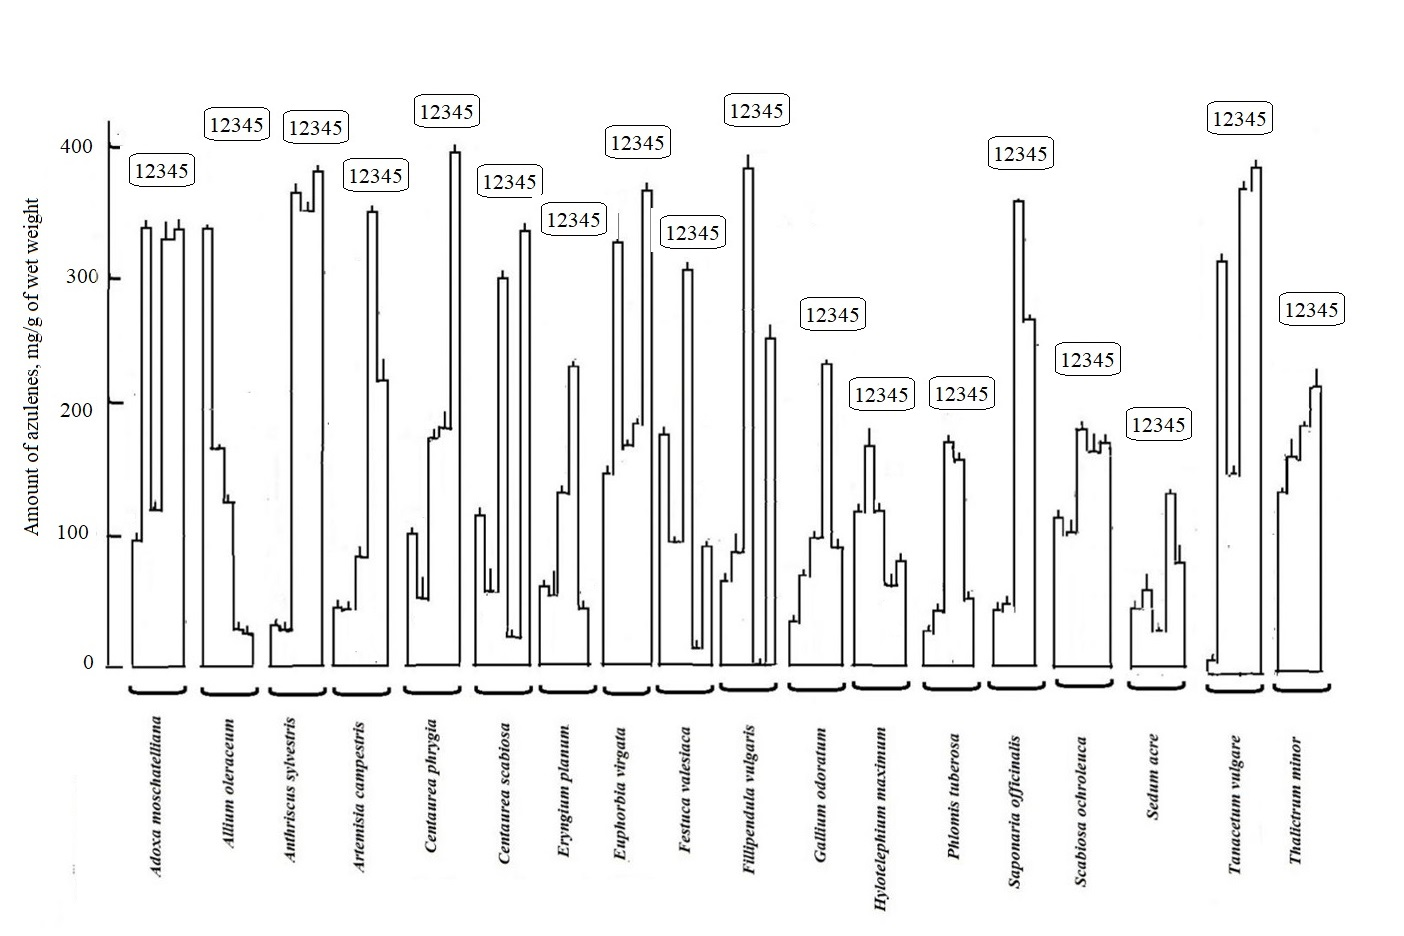
Figure 4: Seasonal dynamics of azulene content (in mg/g of fresh mass) in 10-minute ethanol extracts (leachates) from plant leaves depending on the time of collection, 1 - collection on April 13, 2 –collection on April 29, - 3 from May 13, - 4 from June 1 and 5 from June 11, 2024
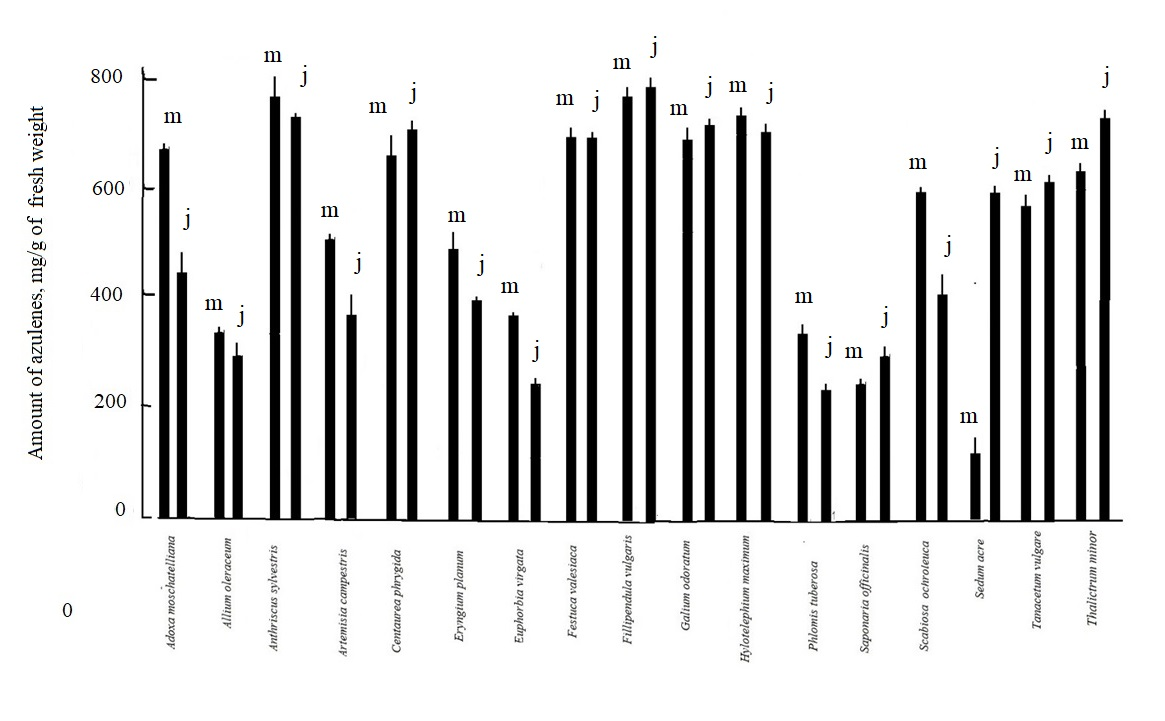
Figure 5: The concentration of azulenes in 24-hour ethanol extracts in May (m) and June(s) from the studied plants minus the data of 10-minute extracts related to surface blue pigments. These data for azulenes can be considered as the content of azulenes inside.
Tables at a glance
Figures at a glance