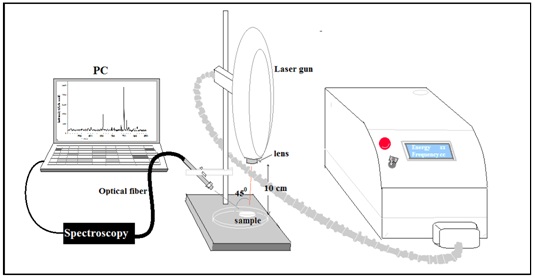
Figure 1 Laser Induced Plasma Spectroscopy (LIBS) system configuration
Figure 1 Laser Induced Plasma Spectroscopy (LIBS) system configuration
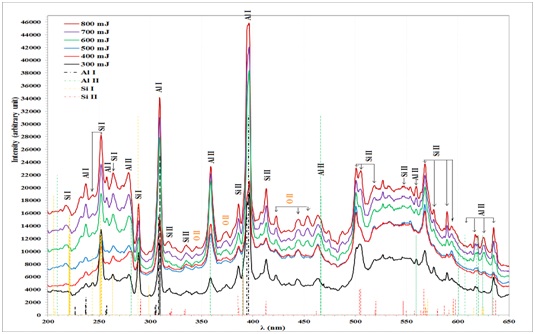
Figure 2 Emission spectra of laser induced on Si-Al alloy target in air with different laser energies
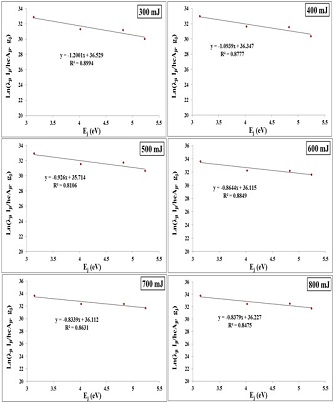
Figure 3 Boltzman plot for plasma produced on Si: Al alloy target in distilled water with different laser
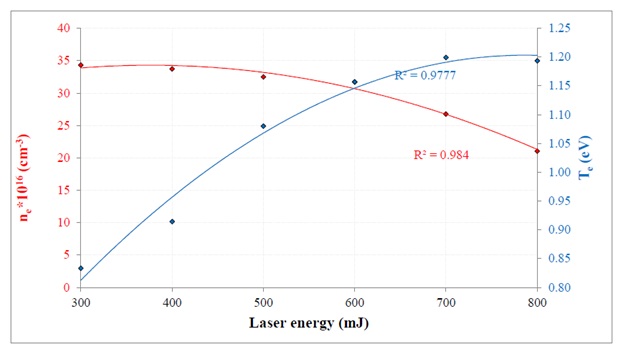
Figure 4 The variation of (Te) and (ne) versus the laser energy for Si: Al alloy in air
Laser energy (mJ) |
Te (eV) |
ne*1016 (cm-3) |
fp (Hz) *1012 |
λD *10-5(cm) |
ND |
300 |
0.833 |
34.308 |
5.260 |
0.116 |
2.231 |
400 |
0.914 |
33.720 |
5.215 |
0.122 |
2.586 |
500 |
1.080 |
32.480 |
5.118 |
0.135 |
3.383 |
600 |
1.157 |
31.708 |
5.057 |
0.142 |
3.796 |
700 |
1.199 |
26.758 |
4.645 |
0.157 |
4.362 |
800 |
1.193 |
21.023 |
4.117 |
0.177 |
4.885 |
Table1 plasma parameters for Si: Al in air with different laser energy