A Simple and Novel Method to Analyze the Fine Texture of Biomaterials: Applications for Product Design, Manufacturing and Preclinical Assessment
Received Date:March 22, 2020 Accepted Date:April 06, 2020 Published Date:April 08, 2020
doi: 10.17303/jmsa.2020.4.102
Citation:Martel T (2020) Fiber Texture Mapping for Biomaterials: Semantic Characterization for Product Design, Device Manufacturing, and Preclinical Assessment. J Mater sci Appl 3: 1-8.
Abstract
We introduce a novel software-based algorithm for texture mapping in two-dimensional images. Using shape-based modeling segmentation (SBMS) based on scale- and angle-invariant Bézier curves, direct optical digital images can be analyzed. The simplicity of this novel approach is in sharp contrast to conventional techniques based on laser scattering or light polarization at the microscopic level or second harmonic generation microscopy. These techniques are technologically complex and spatially limited to the microscopic scale. As an illustration of the simplicity and versatility of our platform, we used direct bright field optical images of glutaraldehyde-treated porcine pericardium used in the manufacturing of many bioprosthetic implants, including artificial heart valves. Auditable data describing collagen fiber content, orientation (color-encoded maps), and organization are generated as a relational database. Heart valve (HV) leaflets are subject to significant strains in vivo. Early failure and limited durability have been characteristic of bioprosthetic HV. Despite an early description of the importance of collagen fiber orientation, thickness-guided tissue sorting is the basis for current qualification algorithms. We present a new, fully customizable software solution for the objective, and auditable numerical characterization of collagenous biomaterials using computerized image analysis. This new tool provides a practical, rapid, and cost-effective solution for testing micro structural organization of biomaterials against bench top or in-vivo models and optimizes the qualification, area selection, use polarity and fashioning of naturally derived collagenous products, with the ability to customize cutting paths for automated processing of the biomaterial and manufacturing of devices, including heart valves. One of the most important applications is in affording a method to characterize the structure of biomaterials on a large scale for research as well as production. The potential applications of the Bezier encoding of images is not limited to fiber texture analysis and can potentially revolutionize feature identification and image semantics in life sciences.
Keywords: Bézier curves; collagen; fiber; orientation; pericardium; texture mapping
Introduction
Bézier curves are a well-established mathematical and convenient model for representing smooth curves. They have several advantages over alternative methods. Namely, they can be represented with just a few mathematical points, called “control points.”
Movements of the control points modify the shape of the corresponding Bézier curve in a predictable and intuitive way. Their characteristics are well understood, having been used and studied widely in the nearly 60 years since they were invented. Bezier curves have become a de facto standard for curve representation in many drawing and drafting applications. We are using cubic Bézier curves in our algorithm. Each Bézier curve is represented by a pair of polynomials of the third degree, where n is the degree of the polynomial, t is a parameter that runs from 0 to 1 inclusive, and P is a 2-vector representing a point on a plane having the form:
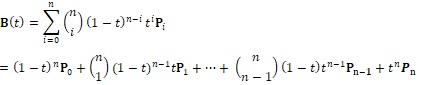
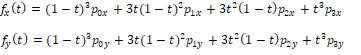
For cubic order, this expression expands to these two polynomials on t:
The polynomial nature of Beziers conveys very useful characteristics. Because they are continuous functions on t, the first and second derivatives of the Bézier curve are guaranteed to be defined everywhere on t. This allows us to bring the power of Calculus to everything that follows. Specifically, we can calculate the slope, angles, normal (perpendicular) to any point on the Bézier, endpoint angles, the radius of curvature, and point of intersection between an arbitrary line and the Bézier, among other useful calculations. Therefore, we can use the Bézier as an architectural framework for the construction of more elaborate object models, knowing that each step is supported by a solid mathematical foundation.
What is particularly unique about the approach used in this paper is the methodology built into the algorithm that applies Bézier curves derived from the original image pixels at multiple sensitivity thresholds and resolution levels. Essentially, this enables a Bezier-based representation of objects and areas of interest in a manner that is scale- and angle-invariant; these characteristics being mathematically and reproducibly “hard-wired” into the image Bezier abstraction. The parametric generating polynomials can be evaluated using a real number (in the form of double-precision floating-point values) and for that reason can be said to exist at infinite resolution. The polynomials can, therefore, be evaluated at a scale-independent of ground-truth pixels from which they are derived. This has several important implications, one of which is that the algorithm can be used to resample the ground-truth image and by so doing accomplish synchronous detection and other types of measurement similar to those obtained by using phase-locked loop technology in digital signal processing applications. We believe this methodology closely replicates key elements of the mammalian visual cortex, in the sense that we can emulate the exceptionally large dynamic range that is an important characteristic of the visual system of higher animals [1,2,3,4]. Bézier curves, as we are implementing them, can be understood and used as another unit value or "pixel of higher-order" on the ladder of image abstraction, i.e., a unit possessing characteristics of shape, direction, and gradient, and reflecting the morphology of underlying objects as a result of the continuous mathematics that governs physical phenomena such as for instance surface tension and modulus of elasticity.
Bézier curves are mathematical functions that are expressed in a way that makes it comparatively easy to fit them to and characterize real shapes using “control points.” They take the form of polynomials having coefficients that are derived from the position of the control points. Bézier curves in two dimensions are described in “parametric form,” as two polynomials, each in a parameter traditionally identified as t. One of the polynomials expresses the x-coordinate of one point on the Bézier as a function of t, the other polynomial expresses the y-coordinate of the point as a function of t. Because they are in parametric form, the function that describes a given Bézier curve need not be of the form of a mathematical function y = F(x).
In the following figure (Figure 1), Curve ‘A’ represents a mathematical function of the form y = F(x). Note that the function F(x) maps each point on the x-axis to exactly one point on the y-axis. Curve ‘B’, on the other hand, which is simply a copy of curve A rotated through 90°, is not a function in the form y = F(x); this can be seen by observing the vertical red line, which intersects the curve at two distinct values of y for the same x.
Bézier curves circumvent this problem by means of parameterization. Each Bézier curve is represented by two separate polynomials of the same order (in our case, that is third-order or cubic) that are coupled by both being expressed in terms of the same independent variable (or parameter) t. One polynomial gives the value of x in terms of t, the other gives the value of y in terms of t. This can be succinctly expressed as follows: yt = Fy(t) and xt = Fx(t)This makes Bézier curves uniquely suited for describing general edges in images because the locus of points [Fx(t), Fy(t)] with 0 ≤ t ≤ 1 can contain intervals that are vertical and thus multi-valued on the x-y plane, as shown in figure 2 below at point M:
This cubic Bezier curve is generated by the four control points P0, P1, P2, and P3. At point M, the curve “goes vertical,” and is thus multi-valued on the x-y plane.
Our novel image analysis technique converts ground-truth pixels, generated by conventional image sensors, into Bézier curves of cubic (third) order. We chose the cubic order for several reasons. Cubic Béziers can be used to accurately model elliptical objects around their entire circumference using only four Béziers; to achieve the same accuracy with quadratic Béziers, eight are required. Popular drafting programs (such as MS Paint and Gimp) use cubic Béziers as the foundation of their "curve" tools. Cubic Bézier curves are relatively easy to fit sets of points.
Materials and Methods
Specimen Imaging
To demonstrate the simplicity of deployment and flexibility of the method we selected to image a large specimen (bovine pericardium) using conventional bright field optical photographic techniques. The pericardium was harvested fresh, gently stretched flat and fixed with an aqueous solution of 3% glutaraldehyde. An area of the specimen approximately 8x8cm was photographed using either a Keyence VHX6000 stereomicroscope under bright field top illumination immersed in saline to avoid reflective highlights (Figure 3a) or using a Nikon D90 prosumer digital camera fitted with a Nikon macro lens (150mm 1:2.8) exposed in a daylight light box on a blue background. (Figure 3c). The images were saved as Tagged Image File Format (TIFF) and directly encoded using our Bezier algorithm (Figures 3b and 3d).
Bezier Curve Encoding
Our approach to fitting Bézier curves to images involves several proprietary steps, but in general, proceeds as follows. First, it identifies edges by means of a slope threshold detection algorithm. This algorithm operates in four directions (up, down, right, and left). It is similar to a blob detector on a "delta image," meaning an image made up of the first spatial derivative of the brightness of the ground-truth image. Next, we identify those edges that are "continuous enough" to justify the effort (in CPU cycles) of being mathematically fitted by a Bézier curve. Fitting the Bézier curve to the points in those “smooth enough” edges is accomplished using one of several conventional Bézier-fit algorithms; the choice of which to use is made according to the shape characteristics of the “smooth enough” edge. Finally, for each set of continuous points, we select one of several algorithms to find the best fitting Bézier curve.
Bézier curves offer a unique and powerful object model for recognizing and characterizing collagen fibers. They fit well to individual fibers and can be used to characterize fibers by length, shape, as well as how straight or curved individual or groups of fibers are organized at a given scale. Using Bézier curves, other extraneous tissue elements can be filtered out of the image. They also offer a framework for advanced photometry on individual fibers, on groups of fibers, and on the tissue surrounding each fiber. Bézier curves allow for very accurate characterization of the directionality of individual fibers endpoint-to-endpoint or averaging of instantaneous direction along the entire curve. Bezier curves can henceforth be displayed by overlay in the image analyzed and color-coded for selected attributes (angle distribution, curvature, length, etc.) creating visually intuitive heat maps (Figures3b and 3d coded for polar coordinates).
Results
Bézier curves derived for use in this paper were obtained at multiple thresholds and multiple resolutions that are scale and angle invariant. We call the methodology used to collect this data "Shape-Based Modeling Segmentation" (SBMS). The SBMS methodology presented in this paper is designed to collect and save data into an industry-standard relational database. This data allows for the creation of a powerful auditable framework that is transparent and auditable both at the database level and in the image itself (Figure 3 a-d).
Our Bezier encoding produces fully auditable datasets that may be analyzed for any of the constitutive properties (curvature, length, density, angle, etc.). For instance, angle distributions can be color-coded according to polar coordinate intervals as shown in (Figure 4). The data can be exported, analyzed and graphed (Figures 5a-b). Additionally, Beziers can be filtered for specified sets of value for any of the parameters (for instance polar coordinates). Fiber orientation can be filtered according to a pair of preferred coordinates in order to identify regions of the specimen that display bipolar (orthogonal in this case) orientation of collagen fibers. The polar coordinates can be rotated around the dial in order to analyze the strength of the bipolar distribution circumferentially and find which orientation in the region of interest best fits the desired pattern (Figure 6). This type of analysis can be conducted without restrictions on the number of polar coordinates or sets of values for any of the other attributes associated with Beziers (length, curvature, density, etc.).
Discussion
Collagen texture or collagen fiber orientation dictates the mechanical properties of tissues (tensile strength, stiffness, flexibility, etc.) [5,6]. Very few studies have actually correlated fatigue performance and collagen orientation [30]. Characterization of the texture of collagenous implants and of collagen fiber orientation has been approached through laser-based optical imaging such as small-angle light scattering (SALS) [6,7,8] or histologically using complex imaging modalities and advanced mathematical models [6,9,10,11,12,13]. Histological approaches have relied on histochemistry such as Picrosirius red stain in combination with circular polarization [14,15], Herovici stain [16], immunohistochemistry, high-resolution radiography, electron microscopy [17], etc. Second-harmonic generation microscopy (SHG) has been considered to be the gold standard and enables direct texture visualization of collagenous tissues without the need for complex or labor-intensive tissue preparation steps [10,13,18,19,20-27]. SHG equipment is sophisticated and expensive. It does generate tomographic images (3D) but has a limited field of view in the few microns to a few hundred microns. Mueller Polarimetry (MP) is simpler and cheaper to deploy but relies on Picrosirius staining and is also limited spatially to microscopic fields or multiples of stitched microscopic fields [4]. One of the great advantages of our approach is that it is scaled independently and can be used on any imaging platform, ranging from macroscopic to microscopic and nanometric scale using optical (bright field), fluorescence or radiographic modalities. Thus, bioprosthetic implants derived from natural products such as bovine or porcine collagen (e.g. bovine pericardium) can be analyzed for collagen fiber orientation using direct optical photo imaging. Care must be taken to minimize imaging artifacts such as material folds or reflections and highlights such that under optimal illumination the contrast features of the image do represent the collagenous fiber texture.
Our approach presents one major difference from other image analysis techniques that rely on azimuthal orientation analysis, first-order statistics (FOS) or second-order statistics such as grey level co-occurrence matrices (GLCM) [15]. Current azimuthal mapping techniques are derived from direct visualization of collagen fibers (e.g. SHG) or indirect visualization of a bound dye (PSR and MP). The orientation vectors of individual fibers are dependent upon the length of the structural element (Strel) applied [11]. Our approach is based on a scale-invariant and orientation independent best fitting of mathematically defined curves (Beziers). As such they offer a level of abstraction (i.e. encoding) and manipulation not available through other imaging and modeling modalities, supporting filtration of the data based on length, curvature, strength and relational parameters between adjacent curves. FOS texture analysis relies on gray tone distribution of pixels intensity [5,20], and ignores inter-pixel correlations [13].
Transform methods such as Fourier transform analysis are the current gold standard for extracting texture and pattern analysis, Fourier transform is most apt at extracting only one angle for a whole pattern [30,31]. Wavelet transform analysis is able to differentiate between three and only three main directions [30,31,32]and does so on a pre-defined region of interest (scale-dependent).
Whereas all the approaches listed above are useful in detecting and measuring texture parameters (is a fibrillar texture present and how strong it is) they are limited in the number of directions or vectors that can be identified and do not offer any means to mathematically represent or “encode” the spatial distribution of fibers in a scale-independent manner within regions of interest or query the field for specific fiber arrangement or texture patterns that might be of interest for biomedical device design. The paradigm-changing power of the Bezier encoding of digital images is its transformation of the pixel arrangement (i.e. digital image) into a mathematical map of contrast gradients and edges and to do so in a reproducible way that is quantifiable for multiple characters such as curvature, strength, length, relative distributions, etc. , and most importantly is independent of scale and color values.
Collagenous matrices used for biomedical implant applications as well as any products involving fibrillar matrices are usually not well characterized for texture parameters and therefore the correlations between specific texture features and clinical outcomes (i.e. durability, biomechanical properties, calcification, and integration) are poorly characterized. Recent advances have established a strong correlation of collagen fiber orientation and dispersion to tensile strength and fatigue performance of bovine pericardium [6]. Our texture mapping tool provides the means to begin exploring these correlations on a large scale using readily available imaging modalities and thus foreshadow advances in biomaterial sciences that will improve clinical outcomes. An example of a practical solution would be the selection of particular regions of a biomaterial intended to be used in the manufacture of a medical device according to certain angular values of collagen fiber orientation (monopolar or multipolar). The techniques herein described are easy to deploy and can be semi-automated and therefore make it possible to search for the desired pattern in material and establish objective qualification criteria for improved outcomes. These techniques can also be of practical use in the manufacturing process through automation of sampling using cutout tools that follow the guides established through pattern analysis (Figure 7).
Several similar studies have been conducted in the area of computational analysis of digital imagery for characterization of angular alignment, particularly as it relates to quality control in carbon fiber composite structures [1,2]. The work done so far in this field is either based on machine learning (ML) of a training set consisting of a large number of "properly arranged" fiber arrangements in which the machine vision algorithm then detects deviations from the training set, or on an inverse-space analysis of the image that identifies angular distribution by averaging a large number of fiber optical responses in the spatial frequency domain; this method generates statistical information giving angular distributions without identifying the angles of individual short fibers and does not display that data as an overlay on the actual fibers.
A large study was done on the three-dimensional organization of fiber-like structures [3], but this used SHG microscopy to obtain ground truth angle distribution information and then used computational methods to organize and present the results.
Upon close examination of the literature, we conclude that our method is unique in its detection of individual short fibers and in its modeling of each fiber as a polynomial function (Bezier curve) as described earlier, in its direct measurement of the angle of these Bezier curves by means of a line segment mathematically connecting the endpoints of each Bezier curve, by the removal of background texture artifacts by direct semantic analysis of the edges arising from these artifacts, and by the use of a relational database to receive the results and make them available for sorting, querying, and presentation in a variety of forms for different purposes.
The methodology proposed provides an opportunity to collect a whole new class of data faster and more inexpensively, with opportunities to extend the methodology into several important sub-disciplines by collecting previously unavailable data and storing that data in the form of a relational database for further analysis.
The texture mapping tool that we are presenting is not limited to the characterization of fibrillar matrices or collagenous matrices but can also be used to characterize vascular networks as well as tissue stroma and architecture, cellular or sub cellular features at the microscopic level.
Acknowledgments
We’re indebted to Jessica Belich for her assistance in manuscript formatting and editorial support.
- I Biederman, PC Gerhardstein (1995) Viewpoint-dependent mechanisms in visual object recognition: Reply to Tarr and Bülthoff. Journal of Experimental Psychology: Human Perception and Performance 21: 1506–1514.
- RA Finke (1989) Principles of Mental Imagery. Cambridge, MA; MIT Press.
- WG Hayward, MJ Tarr (1997) Testing Conditions for Viewpoint Invariance in Object Recognition. Journal of Experimental Psychology: Human Perception and Performance 23: 1511–1521.
- RN Shepard, LA Cooper (1982) Mental Images and their Transformations, Cambridge, MA; MIT Press.
- DJ Prockop, KI Kivirikko (1995) Collagens: molecular biology, diseases, and potentials for therapy review). Ann Rev Biochem 64: 403-434.
- A Whelan, J Duffy, RT Gaul, D O’Reilly, DR Nolan, et al. (2019) Collagen fibre orientation and dispersion govern ultimate tensile strength, stiffness and the fatigue performance of bovine pericardium. J Mech Behav Biomed Mater 90: 54–60.
- MS Sacks, DB Smith, ED Hiester (1997) A small angle light scattering device for planar connective tissue microstructural analysis. Ann. Biomed. Eng. 25: 678–689.
- W Sun, M Sacks, G Fulchiero, J Lovekamp, N Vyavahare, M Scott (2004) Response of heterograft heart valve biomaterials to moderate cyclic loading. J. Biomed. Mater. Res. 69A: 658–669.
- H Altendorf, E Decencière, D Jeulin, PDS Peixoto, A Deniset-Besseau, E Angelini, et al. (2012) Imaging and 3D Morphological Analysis of Collagen Fibrils. J. Microscopy 247: 161–175.
- R Ambekar, TY Lau, M Walsh, R Bhargava, KC Toussaint (2012) Quantifying collagen structure in breast biopsies using second-harmonic generation imaging. Biomed. Opt. Exp. 3: 2021–2035.
- S Bancelin, A Nazac, BH Ibrahim, P Dokladal, E Decenciere, B Teig, H Haddad, et al. (2014) Determination of collagen fiber orientation in histological slides using Mueller microscopy and validation by second harmonic generation imaging. Optics express 22: 22561–22574.
- S Bancelin, C Aimé, T Coradin, MC Schanne-Klein (2012) In situ three-dimensional monitoring of collagen fibrillogenesis using SHG microscopy. Biomed. Opt. Express 3: 1446–1454.
- LB Mostaço-Guidolin, AC Ko, F Wang, B Xiang, M Hewko, et al. (2013) Collagen morphology and texture analysis: from statistics to classification. Sci Rep. 3: 2190.
- L Rich, P Whittaker (2005) Collagen and Picrosirius Red Staining: A polarized light assessment of fibrillar hue and spatial distribution. Braz. J. morphol. Sci 22: 97-104.
- LC Junqueira, G Bignolas, RR Brentani (1979) Picrosirius staining plus polarization microscopy, a specific method for collagen detection in tissue sections. Histochem. J. 11: 447–455.
- JM Rawlins, WL Lam, RO Karoo, IL Naylor, DT Sharpe (2006) Quantifying Collagen Type in Mature Burn Scars: A Novel Approach Using Histology and Digital Image Analysis. J. Burn Care Res. 27: 60–65.
- FO Schmitt, CE Hall, MA Jakus (1942) Electron microscope investigations of the structure of collagen. J. Cell. Comp. Physiol 20: 11–33.
- PJ Campagnola, AC Millard, M Terasaki, PE Hoppe, CJ Malone, WA Mohler (2002) Three-Dimensional High-Resolution Second-Harmonic Generation Imaging of Endogenous Structural Proteins in Biological Tissues. Biophys. J. 82: 493–508.
- R Cicchi, D Kapsokalyvas, V De Giorgi, V Maio, A Van Wiechen, D massi, T Lotti, FS Pavone (2010) Scoring of collagen organization in healthy and diseased human dermis by multiphoton microscopy. J. Biophoton 3: 34–43.
- I Freund, M Deustch (1986) Second harmonic microscopy of biological tissue. Opt. Lett. 11: 94–96.
- T Guilbert, C Odin, Y Le Grand, L Gailhouste, B Turlin, F Ezan, Y Désille, et al. (2010) A robust collagen scoring method for human liver fibrosis by second harmonic microscopy. Opt. Exp. 18: 25794–25807.
- K Lu, J Chen, S Zhuo, L Zheng, X Jiang, X Zhu, J Zhao (2009) Multiphoton laser scanning microscopy of localized scleroderma. Skin Res. Technol. 15: 489–495.
- Y Mega, M Robitaille, R Zareian, J McLean, J Ruberti, C DiMarzio (2012) Quantification of lamellar orientation in corneal collagen using second harmonic generation images. Opt. Lett. 37: 3312–3314.
- PJ Su, WL Chen, TH Li, CK Chou, TH Chen, YY Ho, et al. (2010) The discrimination of type I and type II collagen and the label-free imaging of engineered cartilage tissue. Biomat. 31: 9415–9421.
- M Strupler, AM Pena, M Hernest, PL Tharaux, JL Martin, E Beaurepaire, et al. (2007) Second harmonic imaging and scoring of collagen in fibrotic tissues. Opt. Express 15: 4054–4065.
- SL Wu, H Li, H Yang, X Zhang, Z Li, S Xu (2011) Quantitative analysis on collagen morphology in aging skin based on multiphoton microscopy. J. Biomed. Opt. 16: 040502 (1-3).
- A Zoumi, X Lu, GS Kassab, BJ Tromberg (2004) Imaging coronary artery microstructure using second harmonic and two-photon fluorescence microscopy. Biophys. J. 87: 2778–2786.
- W Hu, H Li, C Wang, S Gou, L Fu (2012) Characterization of collagen fibers by means of texture analysis of second harmonic generation images using orientation-dependent gray level co-occurrence matrix method. J. Biomed. Opt. 17: 026007(1-8).
- A Baraldi, F Parmiggiani (1995) An investigation of the textural characteristics associated with gray level co-occurrence matrix statistical parameters. IEEE Trans. Geosci. Rem. Sens. 33: 293–304.
- G Castellano, L Bonilda, LM Li, F Cendes (2004) Texture analysis of medical images. Clin. Radiol. 59: 1061–1069.
- A Lefebvre, T Corpetti, LH Moy (2011) Estimation of the orientation of textured patterns via wavelet analysis. Pattern Recogn. Lett. 32: 190–196.
- MH Bharati, JJ Liu, JF Mac Gregor (2004) Image texture analysis: methods and comparisons. Chemom. Intell. Lab. Syst. 72: 57–71
- AJ Hunt, JP Carey (2019) A machine vision system for the braid angle measurement of tubular braided structures.Text Res J. 89: 2919-2987.
- C Sacco, AB Radwan, R Harik, M Van Tooren (2018) Automated fiber placement defects: automated inspection and characterization, NASA NTRS document ID 20190027133, Society for the Advancement of Materials and Process Engineering; Covina, CA, United States.
- Z Liu, D Pouli, D Sood, A Sundara krishnan, CK Hui Mingalone LM Arendt, et al. (2017) Automated quantification of three-dimensional organization of fiber-like structures in biological tissues, Biomaterials 116: 34-47.
FIGURE 1
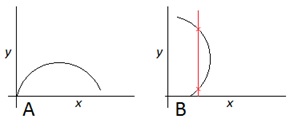
Figure 1: Curve 'A' represents a mathematical function of the form y = F(x). Curve 'B' is simply a copy of curve A rotated through 90°, and is not a function in the form y = F(x).
FIGURE 2
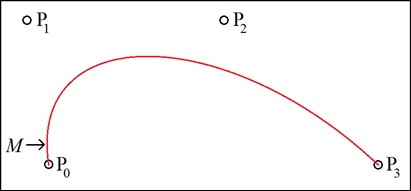
Figure 2: Bezier curve generated by the four control points P0, P1, P2, and P3. At point M, the curve "goes vertical", and is thus multi-valued on the x-y plane.
FIGURE 3
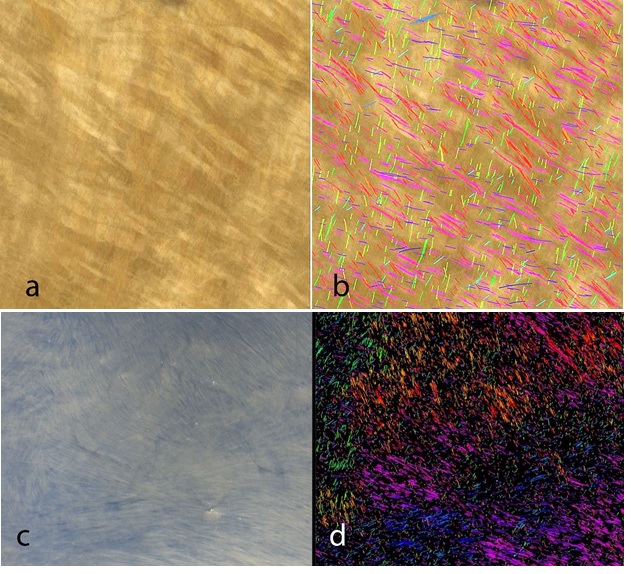
Figure 3: Preparation and Imaging of Bovine Pericardium. Bovine Pericardium was fixed in 3% glutaraldehyde and imaged with a Keyence VHX6000 stereomicroscope (1a) or on a light box and blue background with a prosumer camera (Nikon D7000) fitted with a macro lens (1c). Figures 1b and 1d show the Bezier overlay with a color coding for angle distribution (see Figure 2).
FIGURE 4
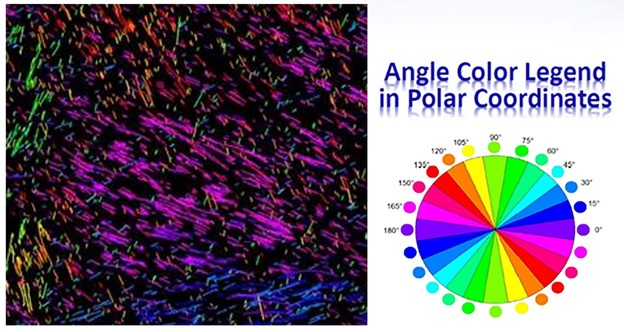
Figure 4: Angle Colors on Bovine Pericardium Tissue. Collagen fibers detected on the digital image by means of fitted Bezier curves. In this case, we are calculating the angle of each Bezier curve and assigning colors in increments of fifteen degrees based upon the color chart (Angle Color Legend in Polar Coordinates). The Bezier curves are rendered against a dark background using multiple thresholds and multiple resolutions. Displayed are the large radius of curvature (greater than 20 pixels).
FIGURE 5A
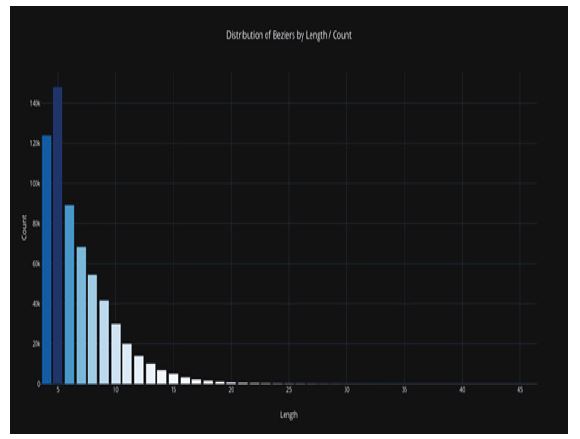
Figure 5A: Bezier Curves by Length for Bovine Pericardium Tissue: bar chart of Bezier curves by length. The x-axis represents the Bezier curve length in pixels and Y-axis is a count of Bezier. The distribution indicates a dominance of high lengths which reflects the streaming arrangement of collagen fibers in the specimen.
FIGURE 5B
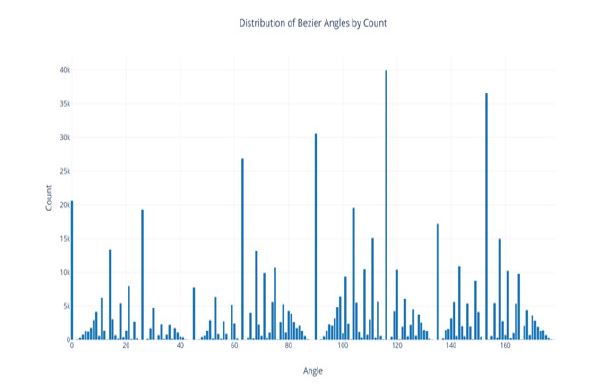
Figure 5B: Figure 5B. Bezier curves by Angle for Bovine Pericardium Tissue. The frequency of Bezier by a polar angle is displayed; the X-axis represents the polar position from 0-180 degrees and the Y-axis is a count of Bezier. The graph shows discrete peaks denoting the dominant orientation of collagen streams in the specimen.
Figures 5A and 5B. Examples of the type of data that can be collected from the image database using a Python charting library designed for life sciences.
FIGURE 6
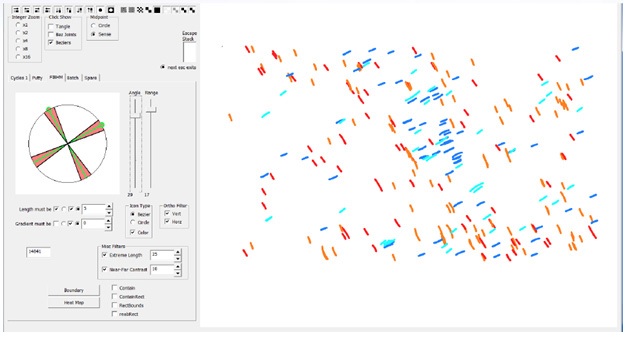
Figure 6: Fiber Angle Screening Tool. A prototype of a screening tool that can be used to screen Bezier fibers based upon length, angle and a number of other variables. This demonstrates the power and flexibility of collecting and displaying data in a form that creates a visual record.
FIGURE 7
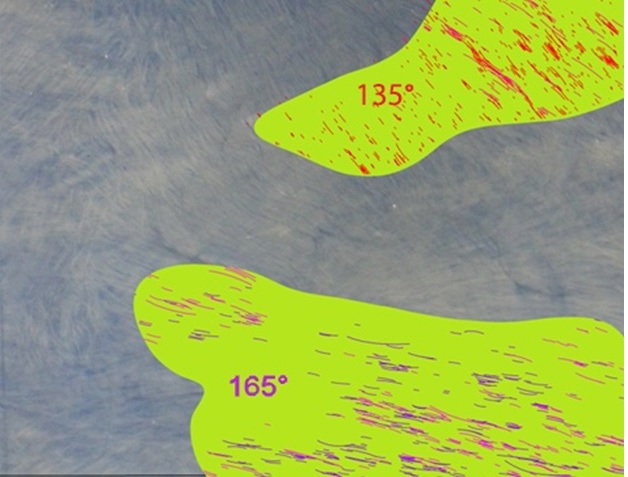
Figure 7: Biomaterial Qualification and Sampling. A prototype of a biomaterial cut out tool driving sampling of regions matching certain texture parameters.Several similar studies have been conducted in the area of computational analysis of digital imagery for characterization of angular alignment, particularly as it relates to quality control in carbon fiber composite structures [1,2]. The work done so far in this field is either based on machine learning (ML) of a training set consisting of a large number of "properly arranged" fiber arrangements in which the machine vision algorithm then detects deviations from the training set, or on an inverse-space analysis of the image that identifies angular distribution by averaging a large number of fiber optical responses in the spatial frequency domain; this method generates statistical information giving angular distributions without identifying the angles of individual short fibers and does not display that data as an overlay on the actual fibers.
Figures at a glance