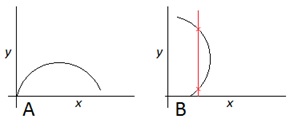
Figure 1: Curve 'A' represents a mathematical function of the form y = F(x). Curve 'B' is simply a copy of curve A rotated through 90°, and is not a function in the form y = F(x).
Figure 1: Curve 'A' represents a mathematical function of the form y = F(x). Curve 'B' is simply a copy of curve A rotated through 90°, and is not a function in the form y = F(x).
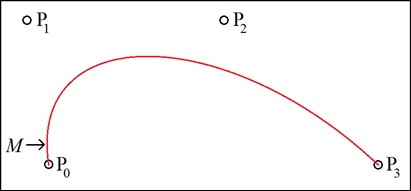
Figure 2: Bezier curve generated by the four control points P0, P1, P2, and P3. At point M, the curve "goes vertical", and is thus multi-valued on the x-y plane.
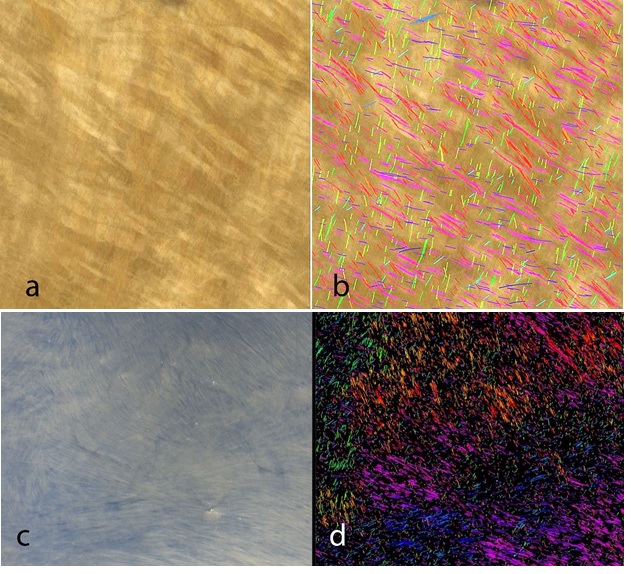
Figure 3: Preparation and Imaging of Bovine Pericardium. Bovine Pericardium was fixed in 3% glutaraldehyde and imaged with a Keyence VHX6000 stereomicroscope (1a) or on a light box and blue background with a prosumer camera (Nikon D7000) fitted with a macro lens (1c). Figures 1b and 1d show the Bezier overlay with a color coding for angle distribution (see Figure 2).
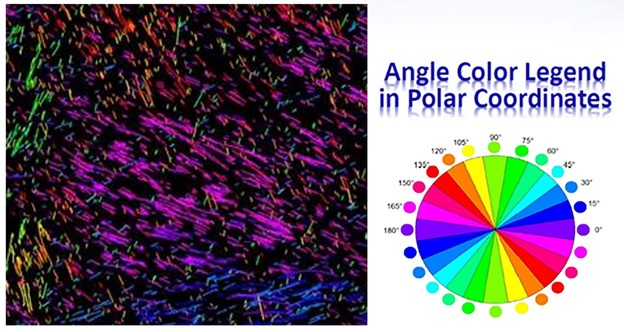
Figure 4: Angle Colors on Bovine Pericardium Tissue. Collagen fibers detected on the digital image by means of fitted Bezier curves. In this case, we are calculating the angle of each Bezier curve and assigning colors in increments of fifteen degrees based upon the color chart (Angle Color Legend in Polar Coordinates). The Bezier curves are rendered against a dark background using multiple thresholds and multiple resolutions. Displayed are the large radius of curvature (greater than 20 pixels).
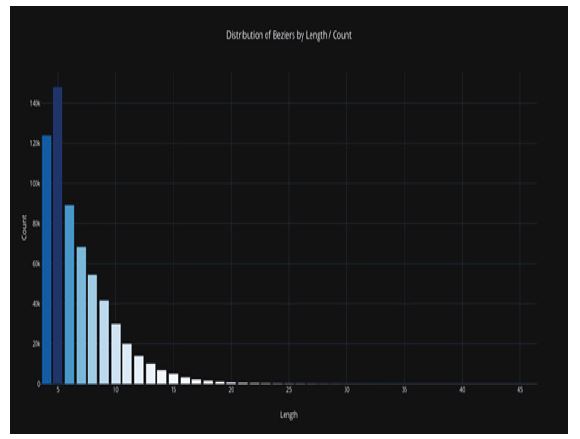
Figure 5A: Bezier Curves by Length for Bovine Pericardium Tissue: bar chart of Bezier curves by length. The x-axis represents the Bezier curve length in pixels and Y-axis is a count of Bezier. The distribution indicates a dominance of high lengths which reflects the streaming arrangement of collagen fibers in the specimen.
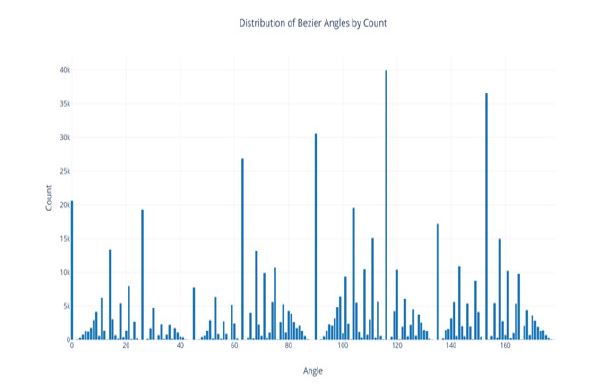
Figure 5B: Figure 5B. Bezier curves by Angle for Bovine Pericardium Tissue. The frequency of Bezier by a polar angle is displayed; the X-axis represents the polar position from 0-180 degrees and the Y-axis is a count of Bezier. The graph shows discrete peaks denoting the dominant orientation of collagen streams in the specimen.
Figures 5A and 5B. Examples of the type of data that can be collected from the image database using a Python charting library designed for life sciences.
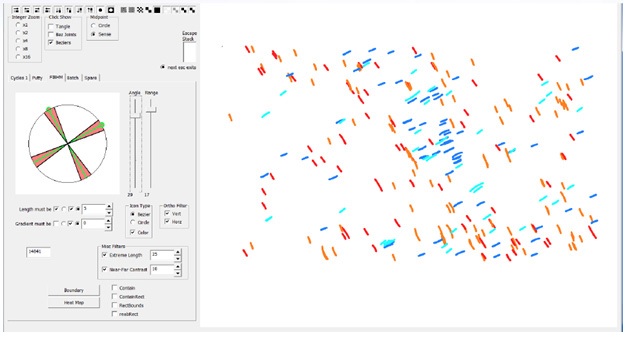
Figure 6: Fiber Angle Screening Tool. A prototype of a screening tool that can be used to screen Bezier fibers based upon length, angle and a number of other variables. This demonstrates the power and flexibility of collecting and displaying data in a form that creates a visual record.
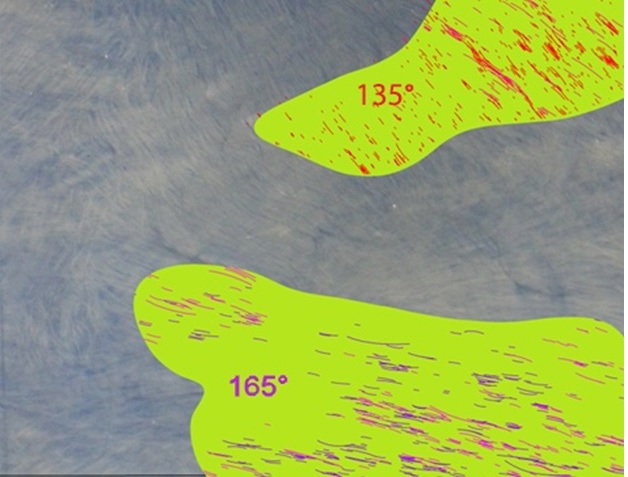
Figure 7: Biomaterial Qualification and Sampling. A prototype of a biomaterial cut out tool driving sampling of regions matching certain texture parameters.Several similar studies have been conducted in the area of computational analysis of digital imagery for characterization of angular alignment, particularly as it relates to quality control in carbon fiber composite structures [1,2]. The work done so far in this field is either based on machine learning (ML) of a training set consisting of a large number of "properly arranged" fiber arrangements in which the machine vision algorithm then detects deviations from the training set, or on an inverse-space analysis of the image that identifies angular distribution by averaging a large number of fiber optical responses in the spatial frequency domain; this method generates statistical information giving angular distributions without identifying the angles of individual short fibers and does not display that data as an overlay on the actual fibers.
Figures at a glance