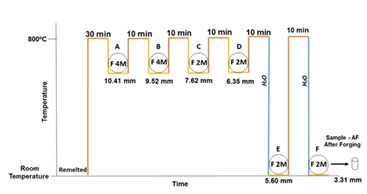
Figure 1:Schematic thermo mechanical process [6].
Figure 1:Schematic thermo mechanical process [6].
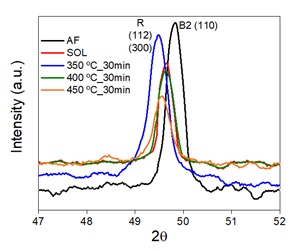
Figure 2:XRD patterns: AF - After Forging (black line) and SOL – Solubilized (red line), Heat Treated Samples: 350 ºC_30min (blue line), 400 ºC_30min (green line) and 450 ºC_30min (orange line).
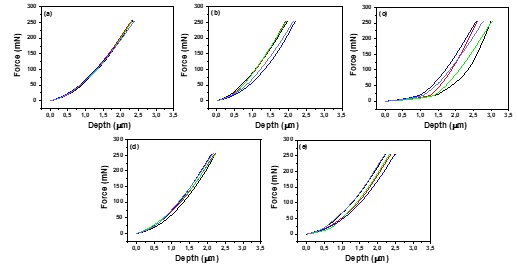
Figure 3: Loading and unloading curves instrumented nanoindentation at 20ºC - Samples: (a) AF - After Forging, (b)SOL - Solubilized, (c) 350ºC/30min, (d) 400ºC/30min and (e) 450ºC/30min.
Figures at a glance