
Figure 1: Schematic representation of plate preparation for welding
Figure 1: Schematic representation of plate preparation for welding
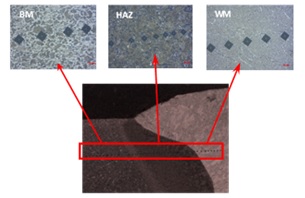
Figure 2: Microhardness test

Figure 3: : Results of macroscopy; (a) seam 1 – before theoretical limit without preheating; (b) seam 2 – after theoretical limit without preheating; (c) seam 3 – before theoretical limit with preheating; (d) seam 4 – after theoretical limit with preheating.

Figure 4: Results of base material optical microscopy analysis. (a) seam 1 – before theoretical limit without preheating; (b) seam 2 – after theoretical limit without preheating; (c) seam 3 – before theoretical limit with preheating; (d) seam 4 – after theoretical limit with preheating.
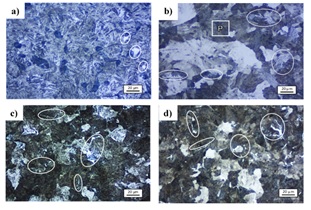
Figure 5: Results of HAZ optical microscopy analysis; (a) seam 1 – before theoretical limit without preheating; (b) seam 2 – after theoretical limit without preheating; (c) seam 3 – before theoretical limit with preheating; (d) seam 4 – after theoretical limit with preheating.

Figure 6: Results of WM optical microscopy analysis; (a) seam 1 – before theoretical limit without preheating; (b) seam 2 – after theoretical limit without preheating; (c) seam 3 – before theoretical limit with preheating; (d) seam 4 – after theoretical limit with preheating.
Figure 7: Curves of microhardness. Specimens 1 at 5 mm before the theoretical limit; Specimens 2 on the theoretical limit and; Specimens 3 at 5 mm after the theoretical limit. At side, left are the curves of Line 1 and at side, right are the curves of Line 2.
Figures at a glance