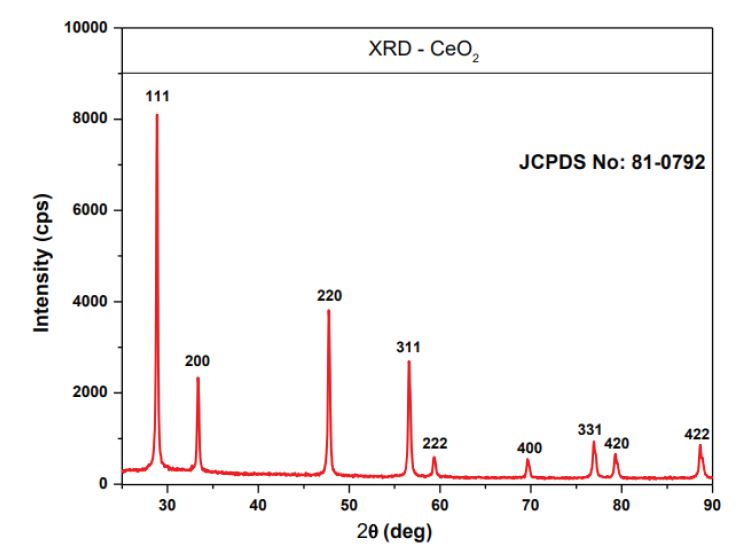
Figure 1: The PXRD pattern of Ceo2 Nanoparticles
Figure 1: The PXRD pattern of Ceo2 Nanoparticles
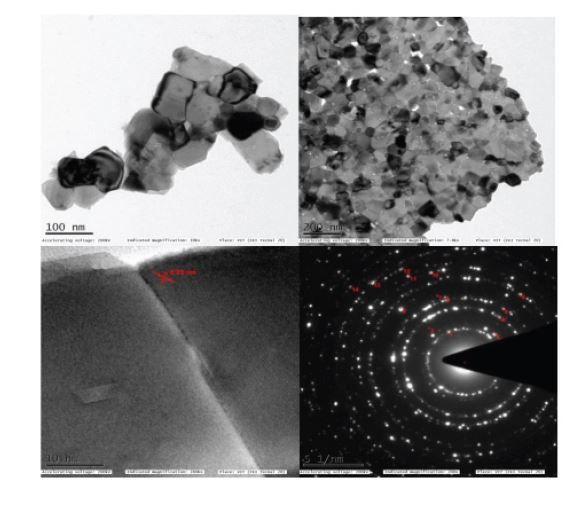
Figure 2: TEM images of Cerium Oxide (Ceo2) Nanoparticles
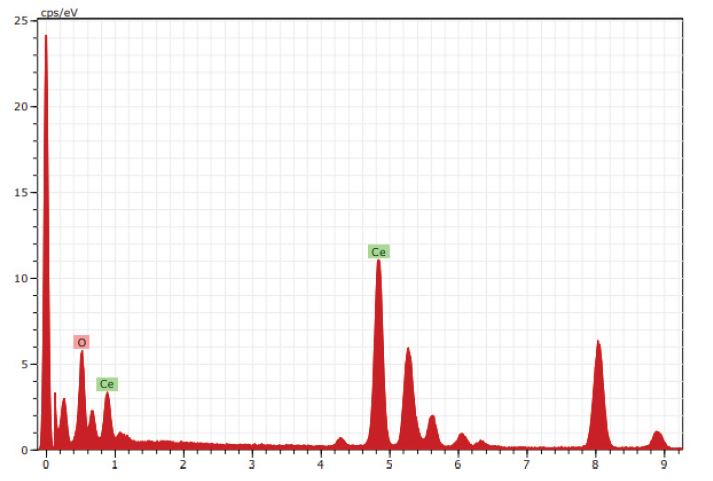
Figure 3: The EDX pattern of Ceo2 Nanoparticles
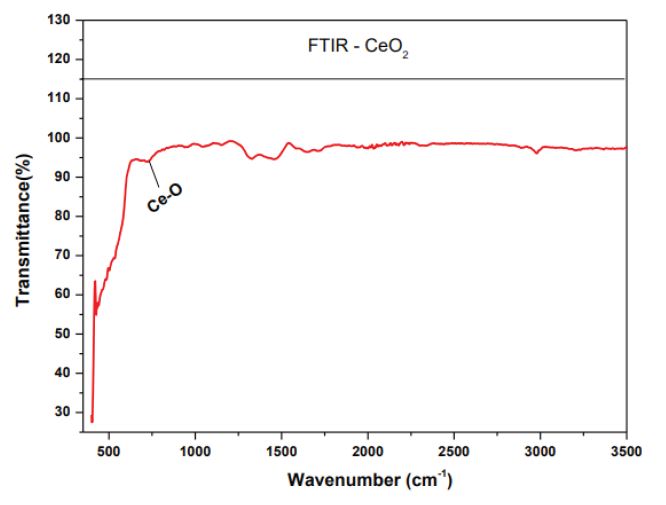
Figure 4: FTIR spectrum of Cerium Oxide (Ceo2)
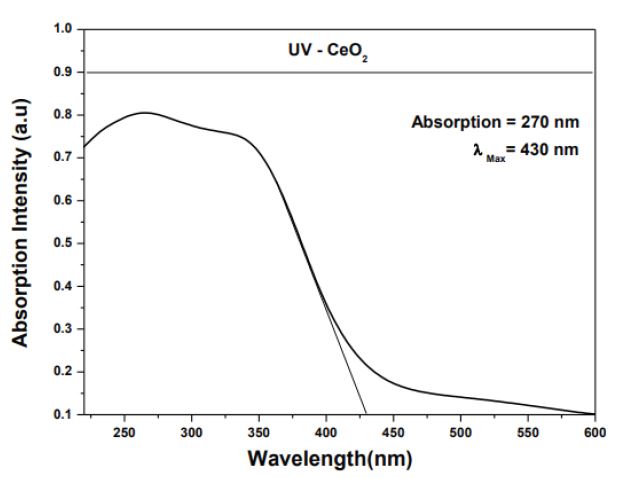
Figure 5a: UV-Vis absorbance spectra of Ceo2 NPs
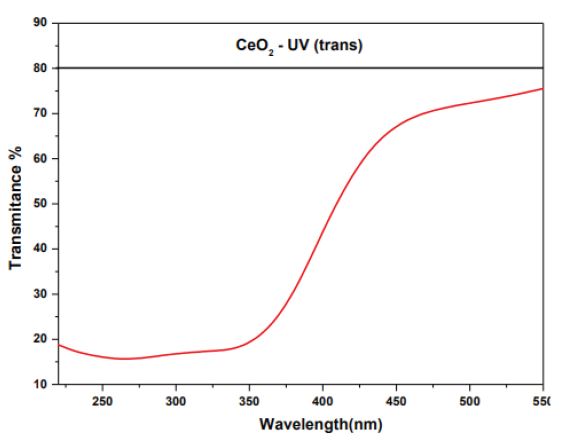
Figure 5b: UV-Vis transmittance spectra of Ceo2 NPs
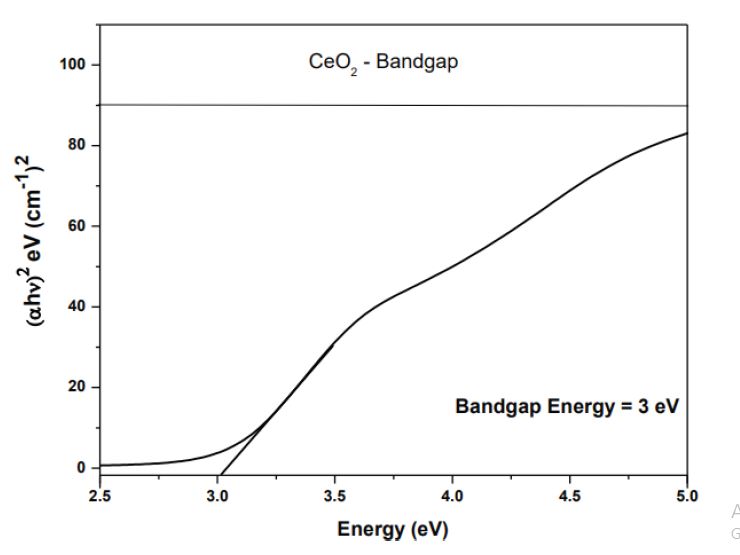
Figure 5c: Photon energy vs.(ahv)2spectrum of Ceo2 NPs
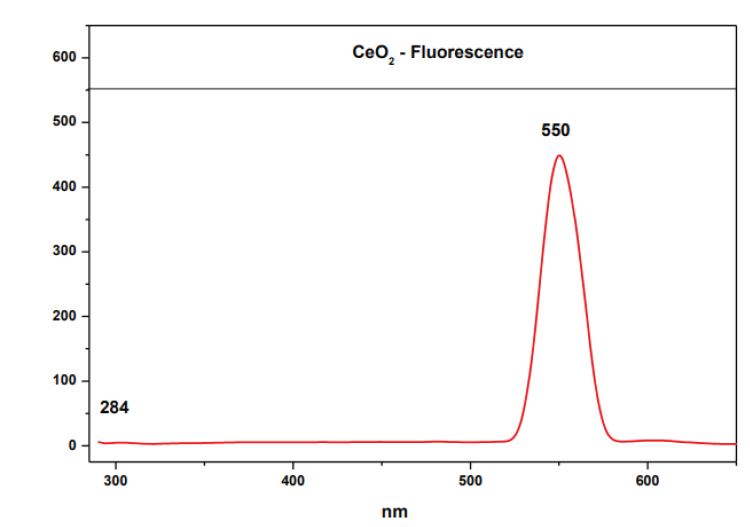
Figure 6: PL spectra of Ceo NPs
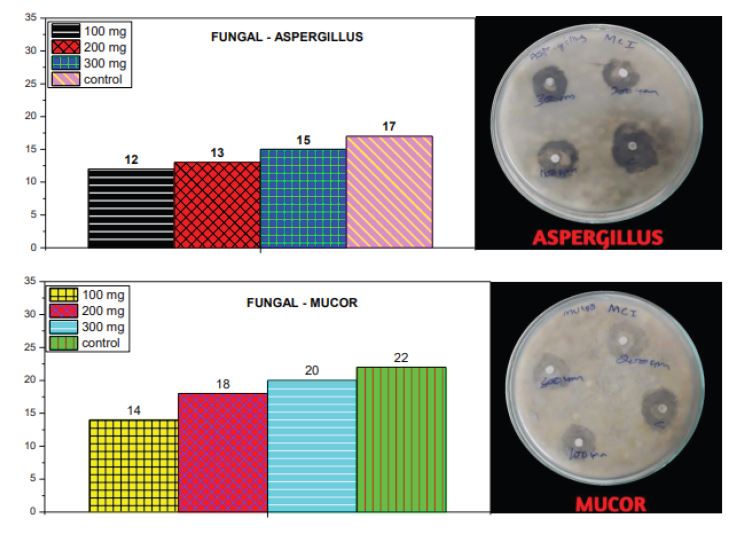
Figure 7: Anti-Fungal activity of Cerium Oxide (CeO)
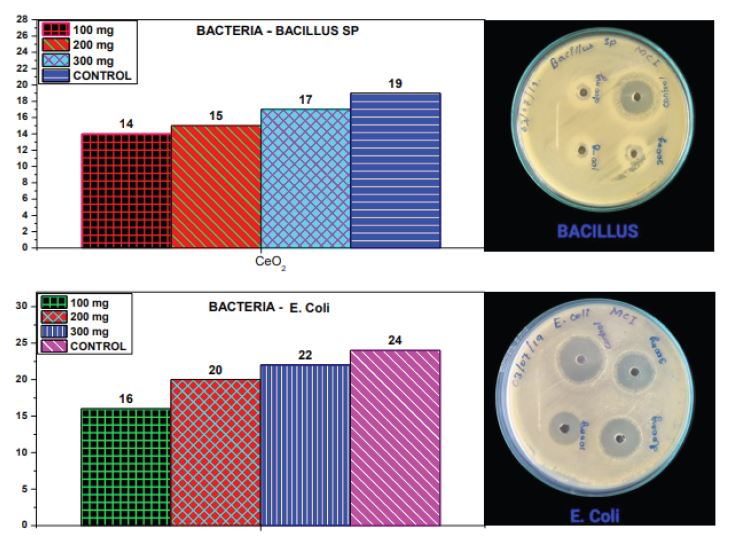
Figure 8: Anti-Bactria of Cerium Oxide (Ceo)
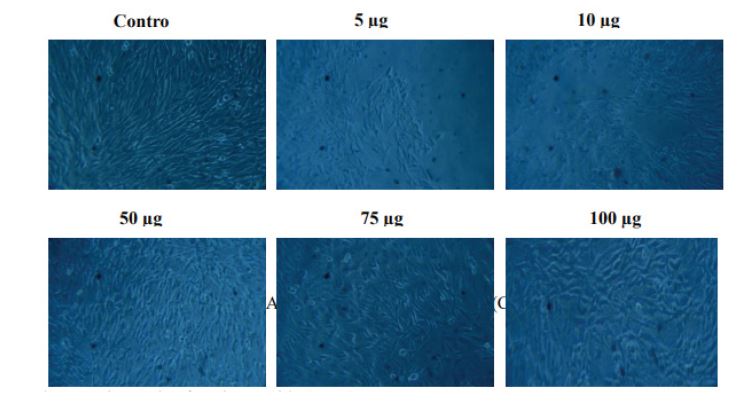
Figure 9: Anti-Bactria of Cerium Oxide (CeO2).
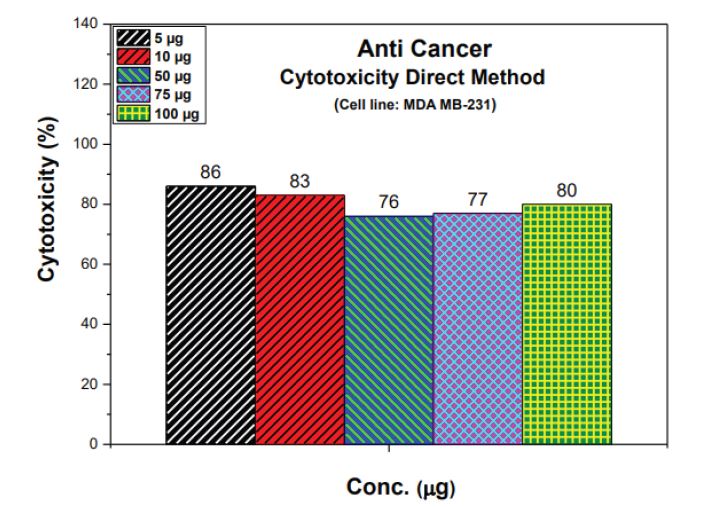
Figure 10: Anti-Bactria of Cerium Oxide (CeO2)
Figure 11: Anti-Bactria of Cerium Oxide (CeO2)
Tables at a glance
Figures at a glance