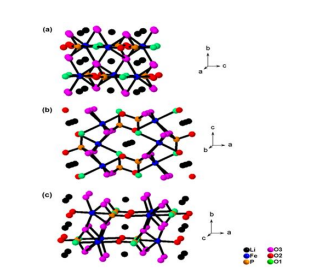
Figure 1: Perspective views of the structure of LiFePO4 in projection along (a) a-axis, (b) b-axis and (c) c-axis
Figure 1: Perspective views of the structure of LiFePO4 in projection along (a) a-axis, (b) b-axis and (c) c-axis
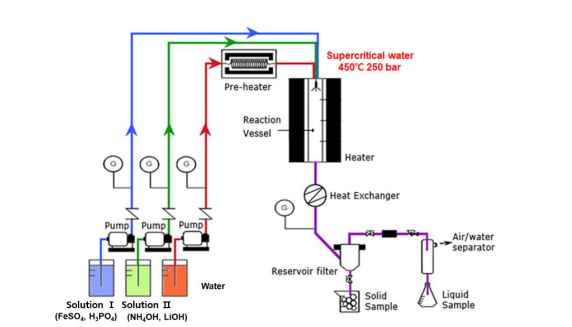
Figure 2: Schematic illustration of supercritical hydrothermal reaction procedure for synthesis of nonstoichiometric lithium iron phosphate
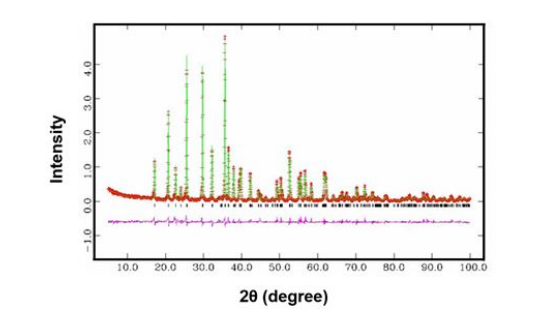
Figure 3: Rietveld refinement of X-ray diffraction patterns for sample I corresponding to Li0.87FeP0.96O3.94. Color code: red; collected pattern, green; refined pattern, pink; difference between collected and refined pattern
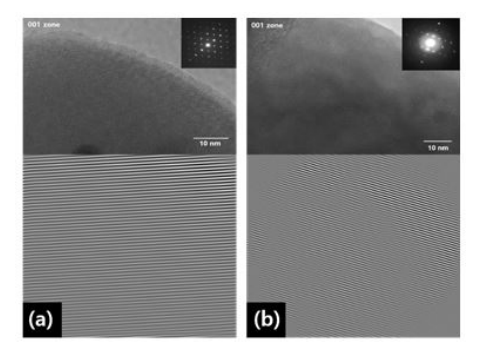
Figure 4: HR-TEM image and SAED pattern, indexing of diffraction patterns and Fourier-filtered image in 001 zone, (a) LiFePO4 , (b) Li0.87FeP0.96O3.94
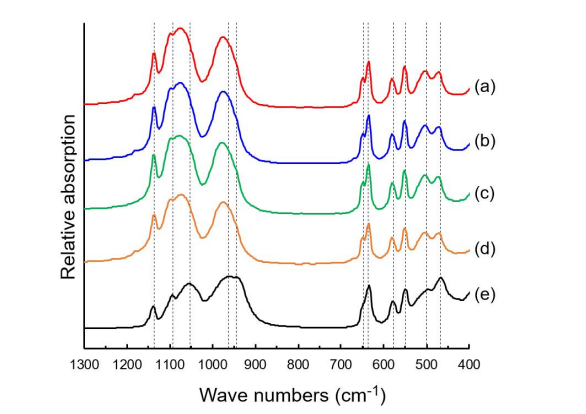
Figure 5: FTIR spectra of (a) sample Ⅰ, (b) sample Ⅲ, (c) sample Ⅳ, (d) sampleⅥ and (e) commercial LiFePO4
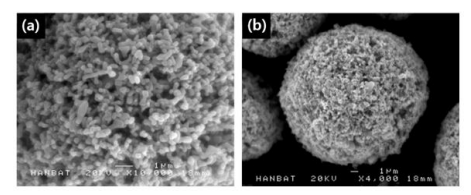
Figure 6: SEM images of Li0.87FeP0.96O3.94 , (a) the primary powders, (b) the granules
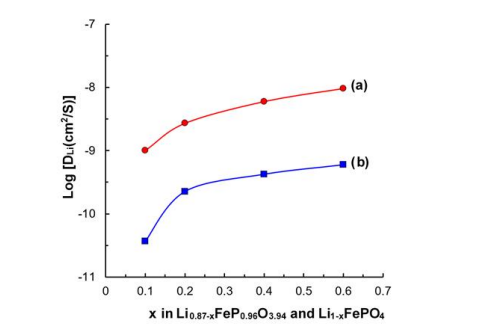
Figure 7: Variation of lithium ion diffusion coefficient vs x for (a) Li0.87-xFeP0.96O3.94 and (b) Li1xFePO4
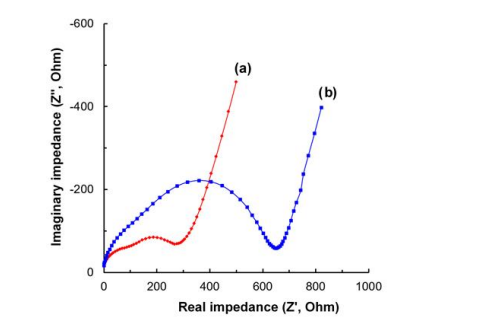
Figure 8: Nyquist plots of impedance for (a) Li0.87FeP0.96O3.94 and (b) LiFePO4
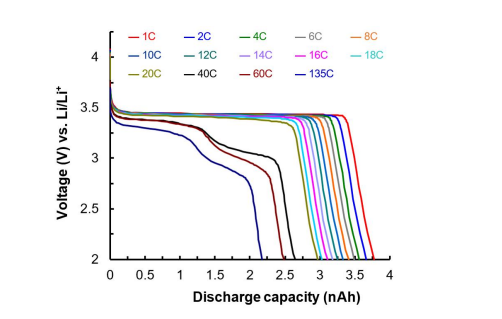
Figure 9: Discharge curves of Li0.87FeP0.96O3.94//Li micro-battery at various C-rates
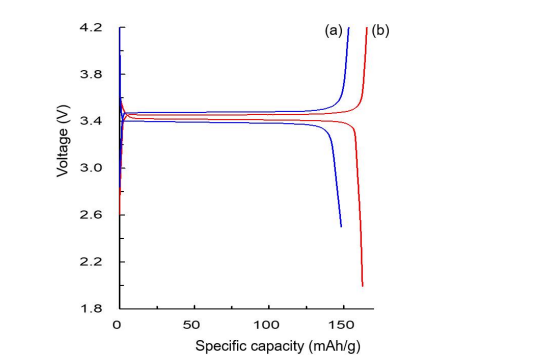
Figure 10: Charge and discharge curves of (a) LiFePO4 //Li cell and (b) Li0.87FeP0.96O3.94//Li cell at 0.1 C
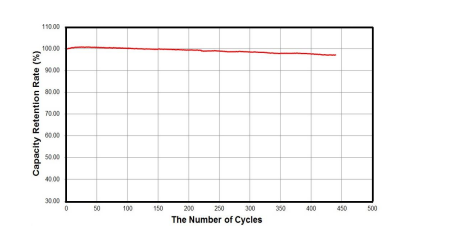
Figure 11: Capacity retention rate vs the number of cycles of Li0.87FeP0.96O3.94//Li cell at 1 C
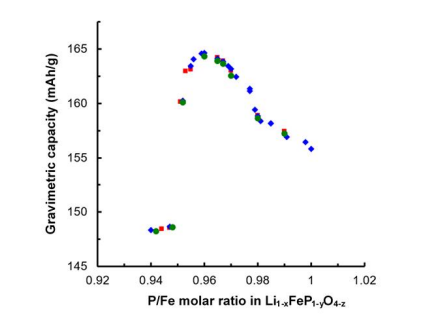
Figure 12: Variation of the specific capacity vs P/Fe molar ratio in Li1-xFeP1-yO4-z
Tables at a glance
Figures at a glance