FIGURE 1
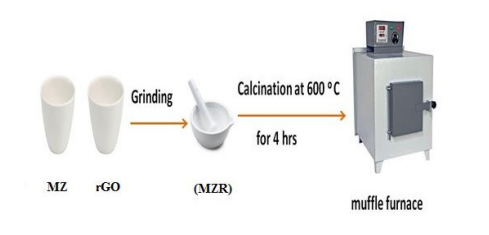
Scheme 1: Schematic Synthesis of Fe3O4 /ZnO/ rGO nanocomposites (MZR)
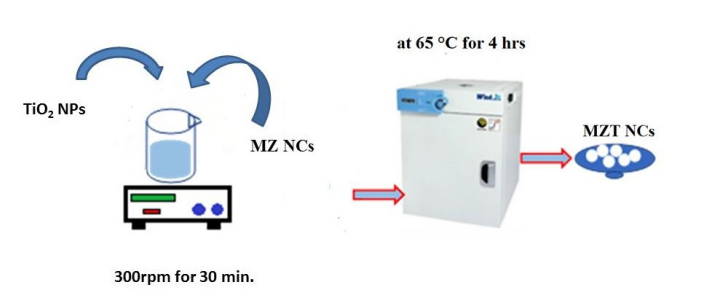
Scheme 2: Schematic Synthesis of Fe3O4 / ZnO /TiO2 nanocomposites (MZT)
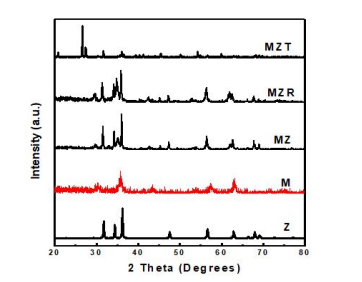
Figure 1: XRD spectra of Z, M, MZ, MZR and MZT nanocomposites
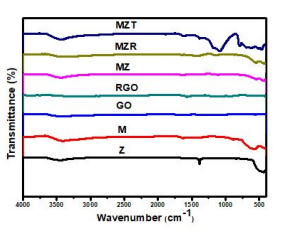
Figure 2: FT-IR spectra of Z, M, MZ, MZR, and MZT nanocomposites
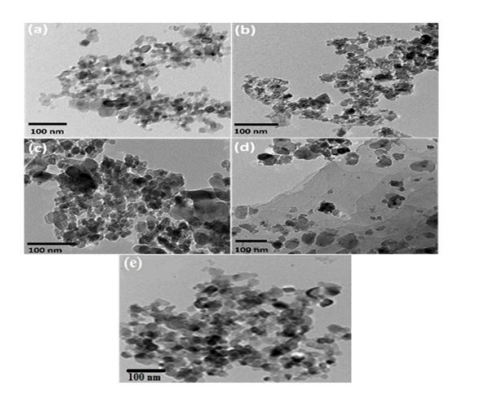
Figure 3: TEM images of Z (a), M (b), MZ (c), MZR (d) and MZT(e)
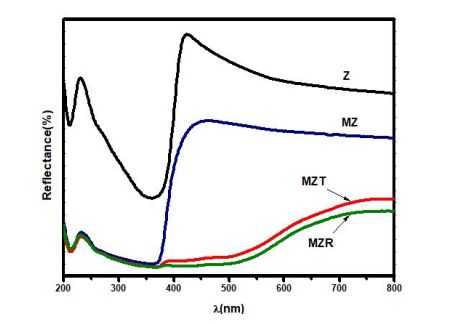
Figure 4: UV-Vis diffuse reflectance spectra of Z, MZ, MZT and MZR NCs
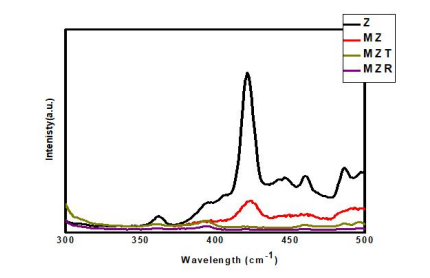
Figure 5: Photoluminescence spectra of Z, MZ, MZT and MZR NCs
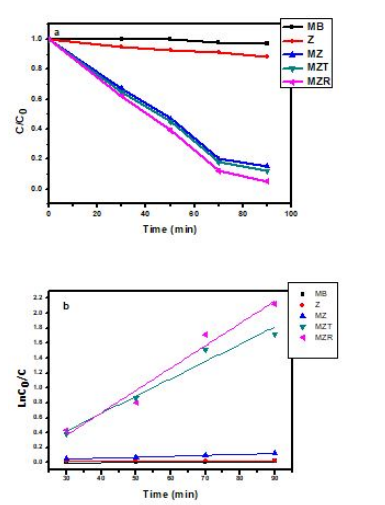
Figure 6: Photodegradation and (b) Kinetic of MB by Z, MZ, MZT and MZR nanocomposites for 100 ppm MB under visible light
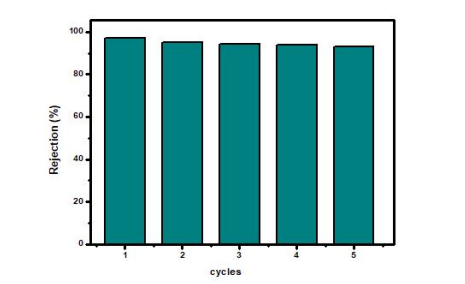
Figure 7: The MZR photocatalytic activity for degradation of organic pollutant remained stable (about 95%) throughout five consecutive cycles
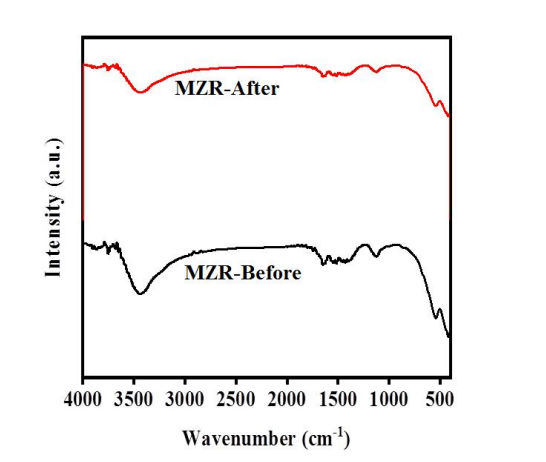
Figure 8: FT-IR spectra of MZR nanocomposites before and after of photocatalytic activity
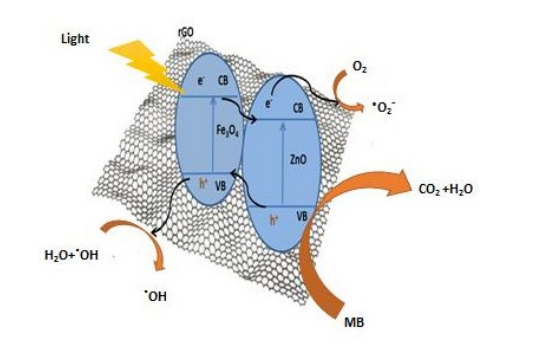
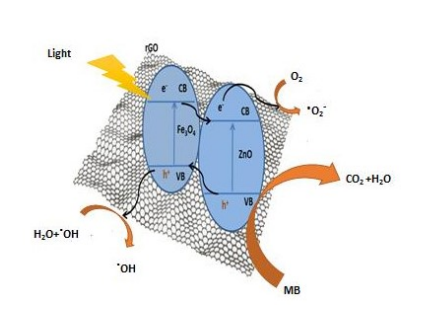
Figure 9: Schematic diagram of MB photodegradation by MZR crystalline nanocomposite under visible light
Tables at a glance
Figures at a glance