Magnetic Ordering Exploration by Study of the Magnetostriction
Received Date: January 02, 2024 Accepted Date: February 02, 2024 Published Date: February 05, 2024
doi:10.17303/jmsa.2024.8.101
Citation: Hank Steve Andia Prado, Nicolae Cretu, Adam Lorinczi, Petre Badica, Iurii Bogomol (2024) Magnetic Ordering Exploration by Study of the Magnetostriction. J Mater sci Appl 8: 1-11
Abstract
By experiment we evaluated the longitudinal magnetostriction on cylindrical samples of MnZn ferrite. Starting from the idea that the magnetostriction phenomenon is closely related to the magnetization phenomenon of the fer- romagnetic sample, by plotting the magnetostriction curve it is possible to extract the magnetization curve of the ferromagnetic material and to eval- uate the saturation magnetization of the material and the demagnetization factor of the sample. At the same time, the paper suggests a way to study the dynamics of the movement of the magnetic domain walls in the sample, by examining the resonance curve at each point on the magnetization curve.
Keywords: Mnzn Ferrite; Magnetostriction Curve; Magnetization Curve
Introduction
The magnetic structure of magnetic materials consists of magnetic do- mains, which are uniaxial wall spacing, closure domain and stripe domains. Domain walls separate one domain from another, inside the wall the magnetic spins change the orientation with angles according the type of the magnetic wall. There are three type of domain walls: Bloch walls, Neel walls and Cross-Tie walls [6]. The magnetization proces which appears when a de- magnetized ferromagnetic body is introduced in an external magnetic field is explained by connected phenomena referring to these magnetic domains and macroscopically explained by the hysteresis cycle. According to this cycle, the component of the macroscopic magnetization along the field direction, firstly increases nonlinearly with a low initial slope, then follows a drastic increase of this slope at intermediate magnetic fields, and then the slope de- creases at higher fields up to the technical saturation. This segment of the magnetization curve is called first magnetization curve. When the field is removed, the macroscopic magnetization decreases along a curve located well above the first magnetization curve. For zero field a noticeable magnetization generally remains, that is called remanence or remanent magnetization, Mr (according to Figure 1).
When the external magnetic field is cyclically applied, the magnetization curve describes the hysteresis loop. If the maximum applied field is not high enough to reach the saturation, the respective loop describes a minor loop. If superimposed to a constant field, a cyclically varying field is applied.
we obtain a hysteresis loop around a point of the hysteresis loop known as shifted loop [1,2]. Generally, the field acting on a magnetized sample can be considered as a sum of the externally applied field and the demagnetizing field, due to the magnetization’s sample itself. The demagnetizing field can be expressed by a term −NM , where N represents demagnetizing factor and M is the magnetization. The demagnetizing factor N , is sample’s geometry dependent, that explains why the hysteresis loop of any material depends on its volume and geometry [3,4].
Specific to materials with magnetic ordering, magnetostriction is a con- sequence of the intimate magnetization processes that take place at the in- troduction of the magnetic material in a magnetic field. Only ferromagnetic materials are characterized by magnetostriction [2,21] because it is closely related to the dynamics of the movement of the magnetic domains inside the sample. This phenomenon can have practical applications in the field of sensors, biosensors or transducers [6-8,22].
Ferrite class materials are frequently studied in order to control the mag- netostriction phenomenon and to use it in applications [11,12,17,18,21]. Being closely related to the magnetization process, for example, for a nikel ferrite NiFe2O4 the behaviour of the dynamic longitudinal magnetostriction follows the increasing of the magnetization’s sample, can reach maximum values and then it can decrease, depending on the applied magnetic field. In Figure 2 we have illustrated a part of such behaviour.
In the present work, we present a study based on the dynamic magne- tostriction measurements for a Mn − Zn spinel ferrite. This ferrite was chosen because it is characterized by a relatively low value of the satura- tion field Hs which can be easily studied in laboratory conditions (it can be saturated at relatively low values of the external field). Additional, the class of spinel ferrites have attracted extensive attention of many researchers due to their peculiar magnetic and electrical properties and wide techno- logical applications in core materials, memory storage, ferrofluid technology, medical diagnosis and magnetic drug delivery [13,15], or special electronic devices using nanocrystalline ferrites [20,23]. In our current study, we explore the dynamic longitudinal magnetostriction in different points on the magnetization curve and from this dependence the value of the saturation magnetization can be detected and evaluated.
Ferrite SamplesFerrites with spinel-type structure may be described by the general for- mula MFe2O4 , where M is a divalent cation [13,15]. The unit cell of spinel contains eight formula units and is usually referred to as space group Fd3m (Oh7) with cations occupying special positions indexed as 8a and 16d [2]. The ideal structure is cubic with close packing of oxygen atoms (32e) in which one-eighth of the tetrahedral and half of the octahedral interstices are occupied. In the case of a “normal” spinel such as zinc ferrite, Zn2+ cations usually prefer to occupy the tetrahedral sites and Fe3+ cations the octahedral sites. The partial replacement of Zn2+ and Fe3+ by other metals in different oxidation states yields to mixed ferrites with different magnetic properties [1,2,3,12]. Special mixed ferrites are obtained by substitution of Fe3+ cations in octahedral sites by rare earth atoms [9,14]. MnZn ferrite is a mixed spinel, in which Mn cations are present on both tetrahedral and octahedral sites [10].
To prepare our samples we used the traditional method of obtaining fer- rites, the ceramic method, which involves chemical reaction at very high tem- peratures. Our MnZn ferrite sample with the formula Mn0.75Zn0.25Fe2O4 was obtained by a 12 hours heating cycle, during which a 1150 C constant temperature level for 4 hours for sintering was ensured. The sample was cooled by a free cooling process, in which the sample returned to room temperature after about 10 hours. In Figure 3 we illustrated the XRD spectrum and the crystallographic indices, by considering a spinel structure with a cu- bic elementary cell [13]. Taking into consideration a such arrangement with a cubic elementary cell and a wavelength of 1.5406 A o for X radiation, a latice constant of 8.4113A o is obtained.
Magnetic behaviour was verified by magnetization measurements on a Measurement System, QD-MPMS-XL-7AC. Figure 4 represents the magnetic cycle of our sample , at three different temperatures 5K, 50K and 300K.
From Figure 4 we evaluated the value of saturation magnetization at room temperature 300K at Ms = 67.5 emu/g. Approximately the same value was obtained by magnetic fluxmeter measurements, made on small cylindrical samples, taking into account the longitudinal demagnetization factor effect [4,5]. By measuring the magnetic flux by axial placing of the measurement fluxmeter’s coil in the magnetization coil we obtained the magnetic induction B. The magnetic induction B0 of the magnetic field in the absence of the ferrite sample from the magnetizing coil was determined using a Hall teslameter. The profile of the magnetic field inside the empty magnetizing coil was also determined; the magnetic field in the center of empty magnetization coil for different values of dc electrical current is illustrated in Figure 5.
The sample we used was a cylindrical Mn0.75Zn0.25Fe2O4 ferrite sample with a diameter of 10 mm and a mass of m = 4.887 g.The flux values mea- sured in the absence and presence of the sample lead to the B0 = 6.2 mT and B = 27 mT values, respectively. Considering for the cylindrical sample a de- magnetization factor of approximately 0.5, the result leads to a correct value of the specific magnetization at room temperature T=300K of 67.35 emu/g. The value is in good agreement with the measurements with the SQUID magnetometer, given by Figure 4. In fact a demagnetizing factor equal to 0.501, lead to the same value obtained by magnetometric measurements.
From the electrical point of view, the behaviour of the ferrite at room tem- perature was evaluated by bulk electric rezistivity measurements, ρ = 0.6272 M Ω m.
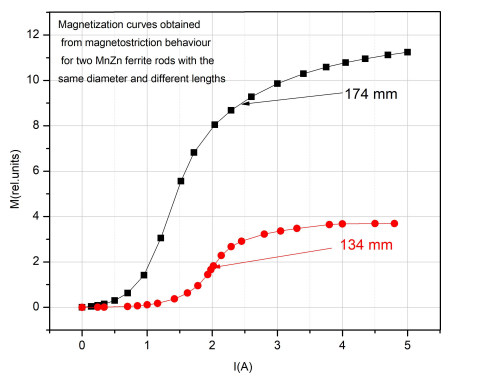
Magnetostriction MeasurementsBy experiment we evaluated the longitudinal magnetostriction on cylindrical samples of Mn0.75Zn0.25Fe2O4 ferrite. Measurements were made in dynamic mode, superimposing an alternative magnetic field of controlled frequency and amplitude over the constant field of the magnetization coil. Longitudinal magnetostriction was measured by optical interferometry using a Doppler vibrometer type VQ-400A. The analogic signal from VQ400A was acquired by a acquisition board USB NI 9215 and the value of longitudinal magnetostriction was evaluated from power spectrum of Fourier analysis. All measurements were made at the resonance frequency of the sample, which depends on the length of the cylindrical sample and naturally of the material. In Figure 6 we plotted two magnetostriction curves for two samples of the same material but different lengths: 174 mm and 134 mm.
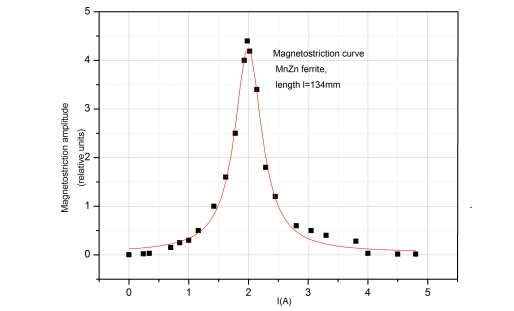
The fitted magnetostriction curve has been redrawn in Figure 7 for the sample of length 134mm.
The idea that the magnetostriction behaviour carries information con- nected to the magnetization curve of the ferromagnetic material can be ex- plained by the graph in Figure 8. The explanation is somewhat similar to choosing of the operating point on the nonlinear characteristic of an electronic amplifier device and the phenomenon is always used to control the level of ultrasound signal in magnetostriction ultrasound generators. In the region where the slope of the magnetization curve is small, the magnetostriction is small, and where the slope is increasing the magnetostriction increases. It is important to mention that the full shape of the magnetostriction curve can only be reached if the entire magnetization process is completed and the ferromagnetic sample is completely magnetized (the magnetization process follows whole magnetization curve including the saturation). This explains for example the case of magnetization process of a Ni ferrite illustrated in Figure 2 where where the maximum magnetostriction curve was not reached.
Maximum of magnetostriction corresponds to the point with maximum slope, in our case for I = 2A for the sample with length l = 134 mm which corresponds to a value of dc magnetic field intensity of approximately 32 Oe. Continuing to increase the dc magnetic field from the magnetizing coil, a portion is reached that corresponds to the saturation magnetization of the material, phenomenon which can be obtained by integration of the magne- tostriction signal from Figure 7. The magnetization curve obtained from the magnetostriction curve after the demagnetization field correction for the cylindrical bar is plotted in Figure 9
If we refer to the dynamic magnetostriction behavior, the magnetization curves for the same material but for two different lengths are plotted in Figure 10. This confirms that the magnetization curve is geometry of the sample dependent, and the demagnetizing field contribution when we bring the sample at saturation. In our case for the sample of length 134 mm, the saturation magnetization is Ms = 3528.4 emu.
Introduction
The work presents a way to estimate the first magnetization curve of a ferromagnetic material by using the magnetostriction measurements. In our research we used a ferrite sample of Mn0.75Zn0.25Fe2O4 , which has the advantage that it can be easily carried to saturation and can be studied at lower magnetic fields, easier to obtain in laboratory. The shape of the dynamic longitudinal magnetostriction curve is closely related to the shape of the magnetization curve and implicitly to the displacement phenomenon of the magnetic domains in the ferromagnetic sample. The dynamic magnetostriction increases with the increase of the magnetic domains and during their reversible rotation. When the irreversible rotations of the magnetic domains appear, the dynamic magnetostriction decreases and reaches a minimum when the sample has reached saturation magnetization. Therefore the shape of the magnetostriction curve can give information about the magnetization state of a ferromagnetic sample and on the other hand, an exploration point by point of the magnetization curve at different values of the dc mag- netic field intensities can give information about the domain wall movement and friction forces at the domain wall boundary
- A Broese Van Groenou, PF Bongers, AL Stuyts (1968) Magnetism microstructure and crystal chemistry of spinel ferrites, Mater. Sci. Eng 3: 317-92
- J Smith (1971) Magnetic properties of materials, McGraw Hill, New York.
- A Goldman (2006) Modern Ferrite Technology, Springer, Pittsbg, 438.
- GM Wysin (2012) Demagnetization Fields, Department of Physics, Kansas State University, Manhattan, KS 66506-2601 Written April, 2012, Florianopolis, Brazil.
- CLB Shuddemagen (1907) The Demagnetizing Factors for Cylindrical Iron Rods, Proceedings of the American Academy of Arts and Sciences 43: 185-256.
- E Vilkov, O Byshevski-Konopko, Stremoukhov P (2022) Magnetic domain wall motion driven by an acoustic wave, Ultrasonics, 119: 106588.
- Valerio Apicella, Ciro Visone (2022) Magnetostrictive Sensors,Encyclopedia of Smart Materials, Elsevier, 117-29.
- PN Anantharamaiah, HM Shashanka, S Saha, JA Chelvane, B Sahoo (2021) Enabling cobalt ferrite (CoFe2O4) for low magnetic field strain responsivity through Bi3+ substitution: Material for magnetostric- tive sensors, Journal of Alloys and Compounds, 877.
- JI Bifa, Tian Changan, Zhang Quanzheng (2016) Magnetic properties of samar- ium and gadolinium co-doping Mn-Zn ferrites obtained by sol-gel auto combustion method, Journal of Rare Earts, 34: 1017.
- S Thota, SC Kashyap, SK Sharma, VR Reddy (2016) Cation distribution in Ni-substituted Mn0.5Zn0.5Fe2O4 nanoparticles: a Raman, M¨ossbauer, X-ray diffraction and electron spectroscopy study, Mater. Sci. Eng. B: Solid-State Materials for Advanced Technology, 206: 69-78.
- Pan Pengfei, Zhang Ning (2016)Magneto dielectric effect of Mn–Zn ferrite at resonant frequency, Journal of Magnetism and Magnetic Materials, 416: 256-60.
- R Arulmurugan, G Vaidyanathan, S Sendhilnathan, B Jeyadevan (2006) Mn–Zn ferrite nanoparticles for ferrofluid preparation: study on ther malmagnetic properties J. Magn. Mater 298: 83-94.
- P Thakur,D Chahar, S Taneja, N Bhalla, A Thakur (2020) A review on MnZn ferrites: Synthesis, characterization and applications, Ceramics International 46: 15740-63
- Pranav PNaik,Snehal SHasolkar,ManojM Kothawale,Satish HP Keluskar (2020) Altering saturation magnetization of manganese zinc ferritenanoparticlesbydoppingwithrareeartNd3+ions,Physica B: Physics of Condensed matter, 584: 412111-6,
- Yao Ying, Xianbo Xiong, Nengchao Wang (2021) Low temperature sintered MnZn ferrites for power applications at the frequency of 1 MHz, Journal of the European Ceramic Society 41: 5924-30.
- R Lebourgeois, JP Ganne, B Llore (1997) High frequency Mn–Zn power ferrites, J. Phys. IV, 07: 105-8
- S Tokatlidis, G Kogias, VT Zaspalis (2018) Low loss MnZn ferrites for applications in the frequency region of 1 − 3MHz, Journal of Magnetism and Magnetic Materials, 465: 727-35
- M Drofenik,A Zˇnidarˇsi,IZajc (1997)Highlyresistivegrainboundariesin doped MnZn ferrites for high frequency power supplies, J. Appl. Phys. 82: 333-40
- MA El Hiti (1999) Dielectric behaviour in Mg–Zn ferrites, J. Magn. Mater 192: 305-13
- BN Sahu, R Prabhu, N Venkataramani, Shiva Prasad R, Krishnan A (2018) Magnetostrictionstudiesin nano-crystalline zinc ferrite thin films by strain modulated ferromagnetic resonance, Journal of Magnetism and Magnetic Materials, 460: 203-6,
- Jean-Luc Mattei, Emmanuel Le Guen, Alexis Chevalier, Anne-Claude (2015) Tarot Experimental determination of magnetocrystalline anisotropy constants and saturation magnetostriction constants of NiZn and NiZnCo ferrites intended to be used for antennas miniaturization, Journal of Magnetism and Magnetic Materials, 374: 762-8.
- Josu´e M, Gon¸calves, Lucas V. de Faria, Amanda B Nascimento, Rafael L. Germscheidt et al. (2022) AngnesSensingperformancesof spinel ferrites MFe2O4 (M = Mg, Ni, Co, Mn, Cu and Zn) based electrochemical sensors: A review, Analytica Chimica Acta 1233: 340362,
- Kebede K. Kefeni, Titus AM Msagati, Bhekie B. Mamba (2017) Ferrite nanoparticles: Synthesis, characterisation and applications in electronic device, Materials Science and Engineering: B, 215: 37-55.
- J. Prat-Camps, C Navau, DX Chen, A Sanchez (2012) Electromagnetics Exact Analytical Demagnetizing Factors for Long Hollow Cylinders in Transverse Field, . IEEE MAGNETICS LETTER 3: 0500104.
Graphical Abstrat
Graphical Abstrat: The magnetization curves obtained from dynamic magnetostriction behavior
FIGURE 1
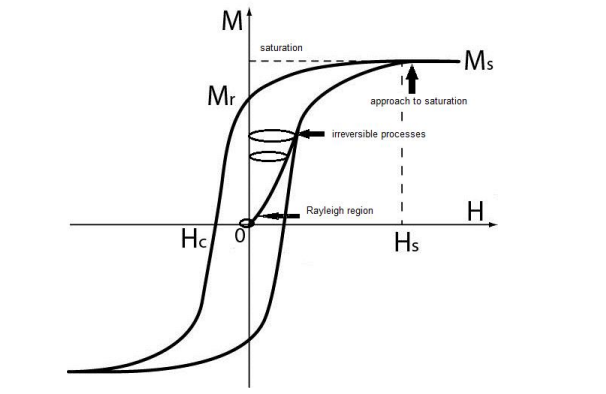
Figure 1: Hysteresis loop of a ferromagnetic material
FIGURE 2
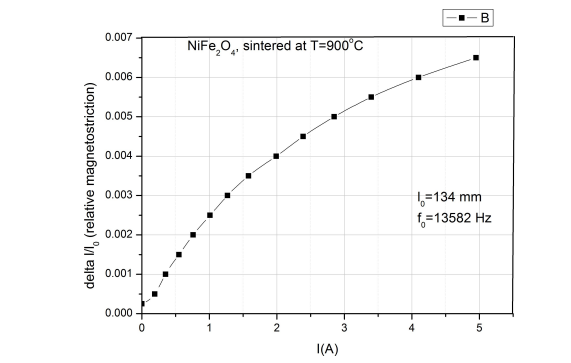
Figure 2: A segment of magnetostriction curve for a Ni ferrite sintered at 900o C
FIGURE 3
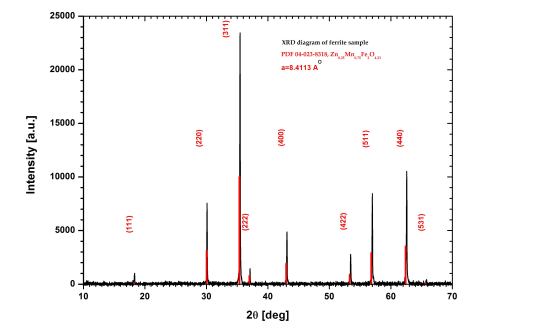
Figures 3 XRD Spectrum of the MnZn ferrite sample
FIGURE 4
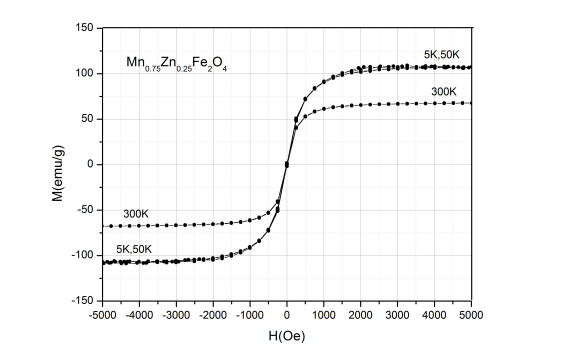
Figures 4 Magnetization cycle of MnZn Ferrite
FIGURE 5
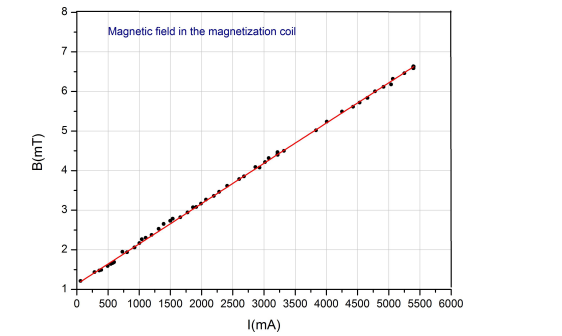
Figures 5 Magnetic field in the center of empty magnetization coil
FIGURE 6
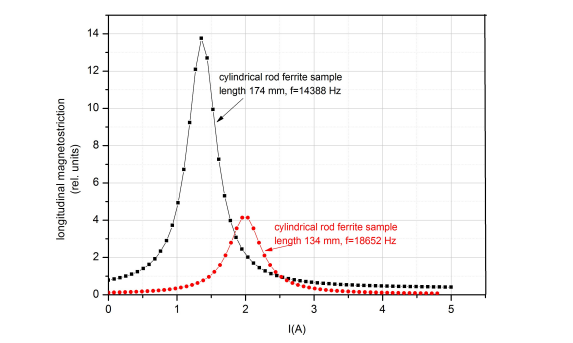
Figures 6 The square of the longitudinal magnetostriction amplitude versus dc magnetiza- tion current obtained by laser Doppler interferometry for two cylindrical samples of MnZn ferrite
FIGURE 7
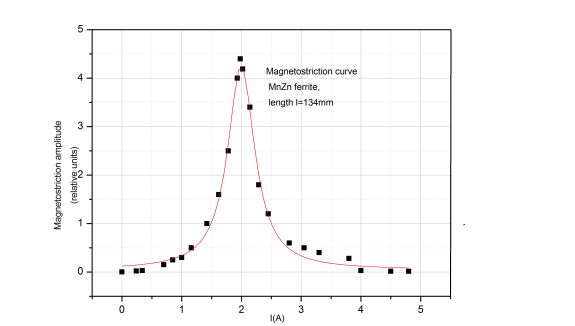
Figures 7 Longitudinal magnetostriction measurements by laser Doppler interferometry of the cilindrycal sample of MnZn ferrite
FIGURE 8
Figures 8 Magnetostriction signal change for different points on the magnetization curve
FIGURE 9
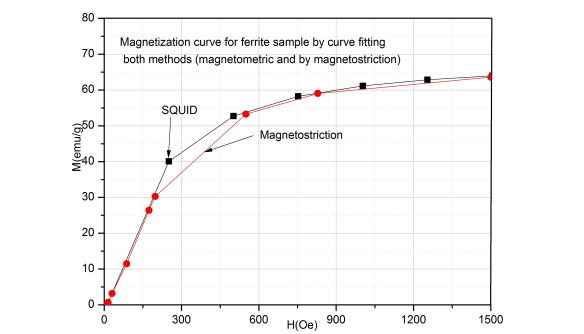
Figures 9 The magnetization curve of the MnZn ferrite obtained by processing of the magnetostriction signal and the magnetization curve obtained by magnetometer measure- ments for the rod sample of 134 mm length
FIGURE 10
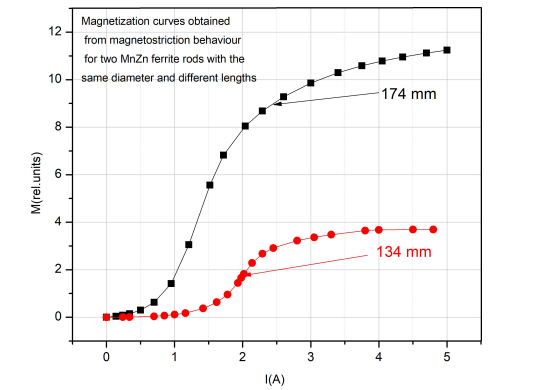
Figures 10 The magnetization curves for the same material and two different geometries of the samples
Figures at a glance