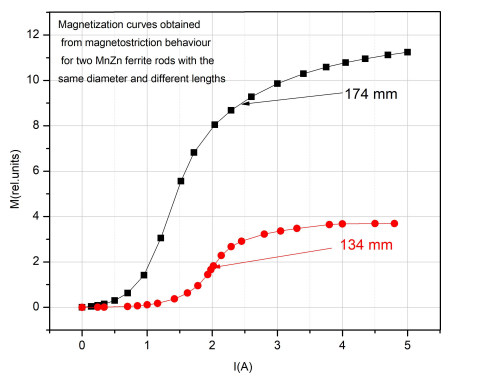
Graphical Abstrat: The magnetization curves obtained from dynamic magnetostriction behavior
Graphical Abstrat: The magnetization curves obtained from dynamic magnetostriction behavior
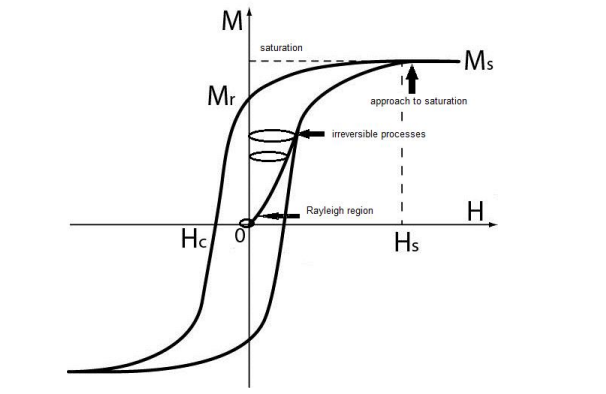
Figure 1: Hysteresis loop of a ferromagnetic material
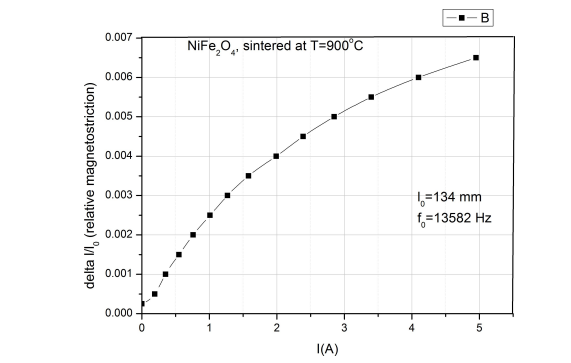
Figure 2: A segment of magnetostriction curve for a Ni ferrite sintered at 900o C
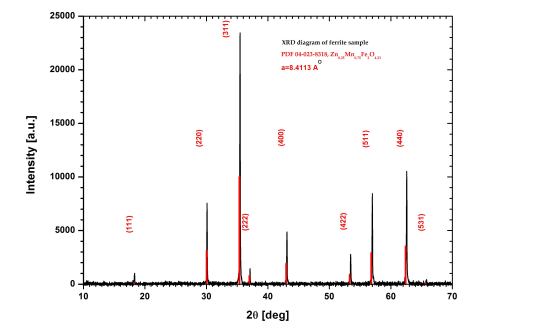
Figures 3 XRD Spectrum of the MnZn ferrite sample
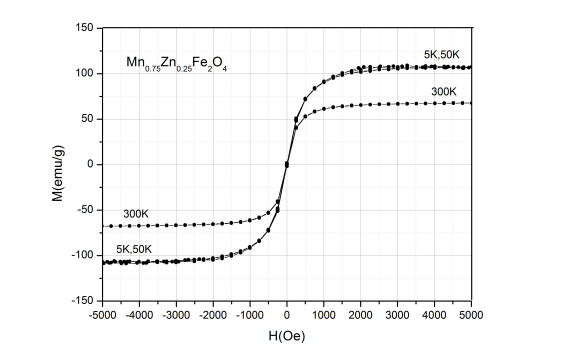
Figures 4 Magnetization cycle of MnZn Ferrite
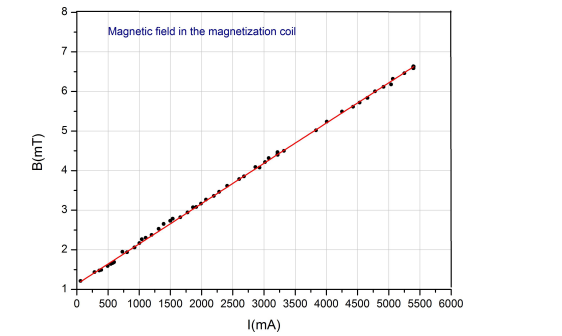
Figures 5 Magnetic field in the center of empty magnetization coil
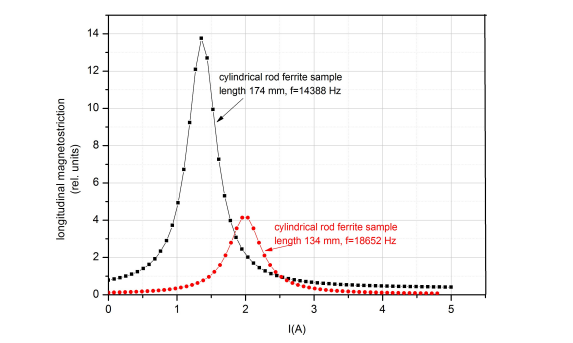
Figures 6 The square of the longitudinal magnetostriction amplitude versus dc magnetiza- tion current obtained by laser Doppler interferometry for two cylindrical samples of MnZn ferrite
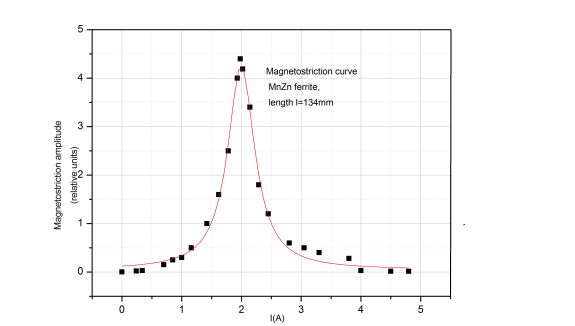
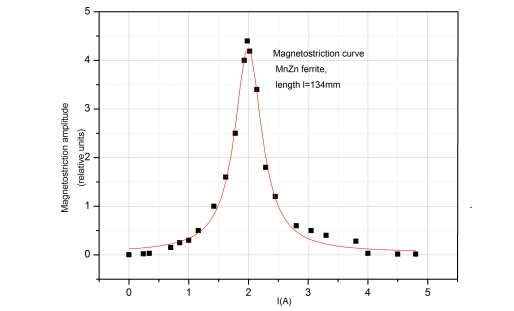
Figures 7 Longitudinal magnetostriction measurements by laser Doppler interferometry of the cilindrycal sample of MnZn ferrite
Figures 8 Magnetostriction signal change for different points on the magnetization curve
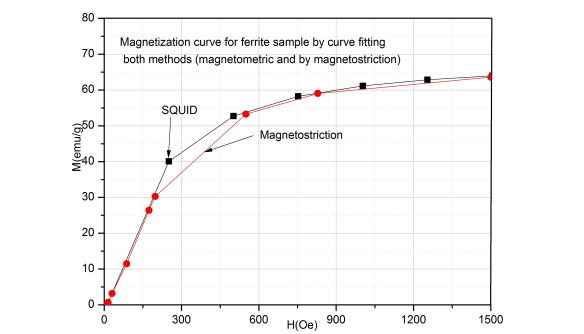
Figures 9 The magnetization curve of the MnZn ferrite obtained by processing of the magnetostriction signal and the magnetization curve obtained by magnetometer measure- ments for the rod sample of 134 mm length
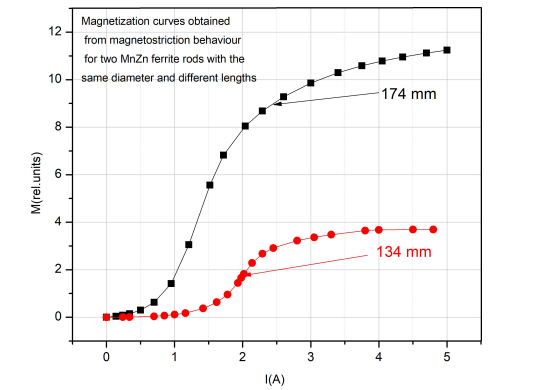
Figures 10 The magnetization curves for the same material and two different geometries of the samples
Figures at a glance